Spiders - March S&P Futures: The S&P Spiders are headed for 144.40. Support today is again at 142.00. The March futures are headed for 1455. Support today is again at 1431.
QQQQ: The market is headed for 44.70. Support today is at 42.95.
March Bonds: The bonds dropped below support yesterday but should hold the 111-00 leve and then rally into the 111-24 to 111-30 range. The market is headed down to 109-110 over the next few weeks.
March 10 Year Notes: The notes should find temporary support near 107-04. The market is headed down into the 105-106 range over the next few weeks.
Euro-US Dollar: I think that a move to 116 and lower has begun. Resistance above the market is still at 132.00.
Dollar-Yen: The market is headed for temporary resistance at 122.00. Support today is at 118.50. I expect to see the yen trade at 130 in 2007.
USO - February Crude: USO is headed for 50.40. Resistance above the market is at 51.80. Resistance in crude oil is at 63.80. I expect crude to drop to 57.50.
GLD - February Gold: GLD rallied above 62.50 resistance yesterday but should stay below 63.00 and then drop to 60.00. I think a big drop in gold is underway and will carry the market below 500. Short term support is 605 while resistance above the market is at 633.
March Silver: I think a big drop in silver is underway and will carry the market below 900. The 1195 level is now short term support and resistance above the market is at 1295.
Google: A move up to 564 is underway.
Friday, December 29, 2006
Thursday, December 28, 2006
Guesstimates on December 28, 8:50 am ET
Spiders - March S&P Futures: The S&P Spiders are headed for 144.40. Support today is at 142.00. The March futures are headed for 1455. Support today should be at 1431.
QQQQ: The market is headed for 44.70. Support today is at 43.20.
March Bonds: The bonds should find temporary support in the 111-16 to 111-20 range. The market is headed down to 109-110 over the next few weeks.
March 10 Year Notes: The notes should find temporary support near 107-28. The market is headed down into the 105-106 range over the next few weeks.
Euro-US Dollar: I think that a move to 116 and lower has begun. Resistance above the market is at 132.
Dollar-Yen: The market is headed for temporary resistance at 122.00. Support today is at 118.50. I expect to see the yen trade at 130 in 2007.
USO - February Crude: USO is headed for 50.40. Resistance above the market is at 51.80. Resistance in crude oil is at 63.80. I expect crude to drop to 57.50.
GLD - February Gold: Resistance in GLD is at 62.50 and the market is headed down to 60.00. I think a big drop in gold is underway and will carry the market below 500. Short term support is 605 while resistance above the market is at 633.
March Silver: I think a big drop in silver is underway and will carry the market below 900. The 1195 level is now short term support and resistance above the market is at 1295.
Google: A move up to 564 is underway.
Wednesday, December 27, 2006
Dow Industrials Domed House
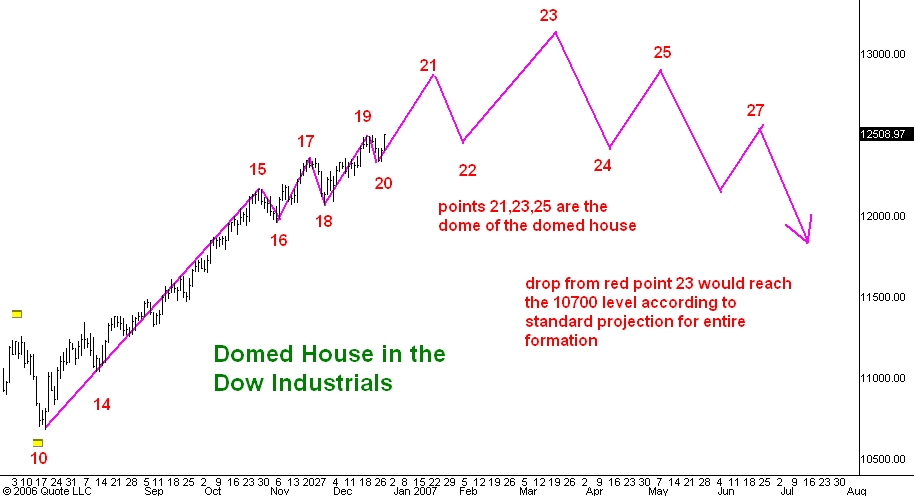
Here is a daily chart of the Dow Industrial average. I have numbered the turning points of this example of George Lindsay's Domed House formation in red. I last commented on this chart here.
I think there is a good chance that the market put in its point 20 low late last week. I am now looking for the dome of the Domed House to form. This will consist of points 21-25 and should assume the shape of a classic "head and shoulders" top. I have revised my estimate of the timing and price level for point 23, the peak of the domed house. Now I think it will occur in late March 2007 in the Dow 13000-13200 range.
Crude Oil ETF's
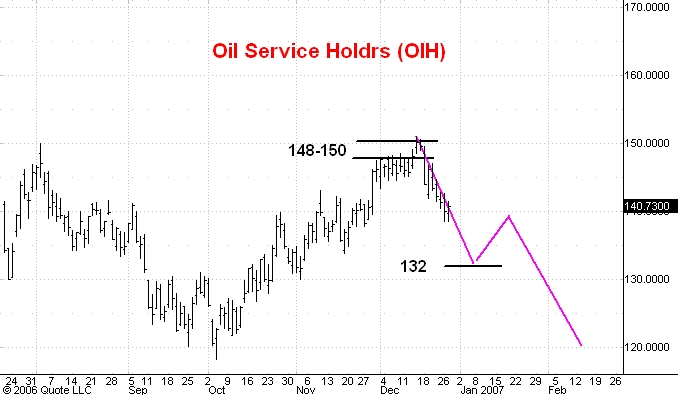
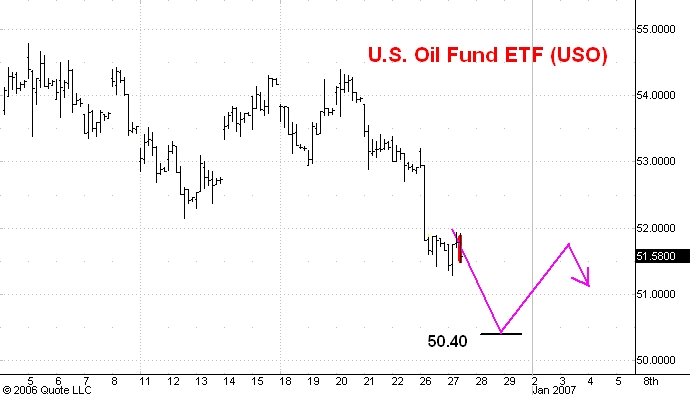
Here is an hourly chart of US OIL (USO), a crude oil ETF, and a daily chart of Oil Service Holdrs (OIH), an ETF of oil service stocks that is highly correlated with the price of crude oil. I last commented on OIH here.
I think the crude oil market is headed much lower over the next few months. The first support beneath the market for USO I see at 50.40. For OIH I see short term support in the 130-32 range. Both markets will probably rally to a lower top from support, but the rally will only be a brief interruption of a much bigger decline.
Gold

Here is an hourly chart of the StreetTracks Gold Trust ETF. I am going to switch my commentary from the gold and silver futures markets to exchange traded funds which track these markets. My last comment on gold is here.
I think that the 62.50 level is strong resistance in GLD. It seems that longer time frame traders think so too. The three bars I have highlighted in red all represent longer time frame selling. The green bar represents longer time frame buying but there was no bullish follow through. So the buyers were accomodated by longer time frame sellers, a bearish development after an extended rally.
I think GLD is headed for 60.00 and eventually below 50.00.
QQQQ

Here is an hourly chart of the Nasdaq 100 Trust tracking stock (QQQQ).
The picture here is not quite as bullish as the picture in the S&P. Today's opening bar was a wide range bar with a close in the lower part of the bar. This indicates longer time frame trader selling. But the next (as yet incomplete) bar hints that there has been no follow through selling and this hint is empasized by the fact that today's early reaction stopped exactly on support at yesterday's high. This tells me that the buyers during the past hour or so are also longer time frame traders and that they are getting impatient because they are buying above yesterday's range.
All in all the picture here I think is a bullish one. I expect the QQQQ to rally to 44.70 over the next week or two. During the first quarter of 2007 I think we shall see a print in the 47-48 range.
S&P
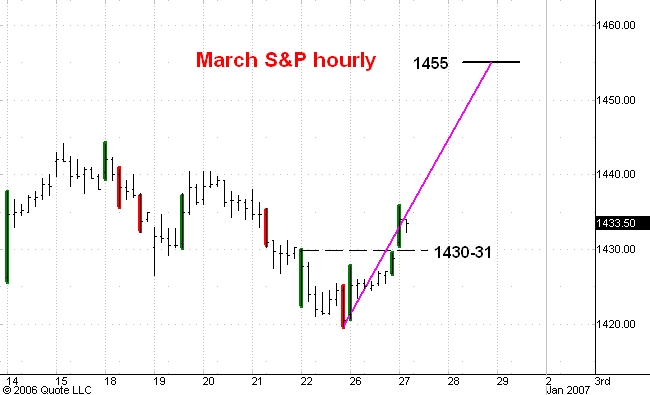

Here are hourly charts of the March S&P e-mini futures and the S&P tracking stock, the Spiders (SPY). I last commented on this market here.
Both these charts tell the same story, but since there is much more trading interest in the Spiders than in the S&P futures I plan to switch the focus of my commentary to the Spiders from the futures.
The S&P futures and the Spiders have both put in wide range up bars in today's opening hour of trading. This shows that longer time frame traders have raised their bids yet again and means that I must abandon my 1416 downside target for the futures.
I think the S&P futures are now headed up to 1455 and the Spiders to 144.40. If I am right about this then yesterday's highs (1430 in the futures, 141.60 in the Spiders) will be support today.
Guesstimates on December 27, 8:50 am ET
March S&P Futures: The market moved above the 1430-31 resistance zone early this morning in European trading. The 1435 level should stop the rally and the next development will then be a drop to 1416 or a little lower. Strength above the 1435 level would force me to abandon the 1416 target and mean that the market is headed for 1455.
March Bonds: The bonds should find temporary support in the 111-16 to 111-20 range. The market is headed down to 109-110 over the next few weeks.
March 10 Year Notes: The notes should find temporary support near 107-28. The market is headed down into the 105-106 range over the next few weeks.
Euro-US Dollar: I think that a move to 116 and lower has begun. Resistance above the market is at 132..
Dollar-Yen: The market is headed for temporary resistance at 122.00. Support today is at 118.50. I expect to see the yen trade at 130 in 2007.
February Crude: Resistance above the market is at 63.80. I expect crude to drop to 57.50.
February Gold: I think a big drop in gold is underway and will carry the market below 500. Short term support is 605 while resistance above the market is at 633.
March Silver: I think a big drop in silver is underway and will carry the market below 900. The 1195 level is now short term support and resistance above the market is at 1295.
Google: Google has entered the 450-55 support zone. The next significant move should be upward to 564.
Tuesday, December 26, 2006
Domed House in Nasdaq 100 Index

Here is a daily chart of the cash Nasdaq 100 index. This index is tracked by an ETF, the Nasdaq 100 Trust, series 1 (symbol: QQQQ). The QQQQ's currently trade at 43.01, just a shade under 2.5% of the cash index which currently stands at 1750.14 (2.5% of which would equal 43.75).
As you know I have been tracking the development of a George Lindsay Domed House formation in the Dow. My last post on this subject can be found here.
I thought I would take a look at the Nasdaq 100 for another point of view on this Domed House. In fact it is developing quite similarly to the Domed House in the Dow industrials. The one obvious difference is that the "five reversals" portion of the Domed House, points 15-20 on the chart, is assuming the more standard, flattened shape in the Nasdaq 100 than in the Dow industrials.
I think the Nasdaq 100 is about to establish point its point 18 low, although I could make an argument that it is in fact point 20 instead. In either case the prognosis is the same: a continuing rally, probably until the end of March. I expect point 23 in the Nasdaq 100 to develop near 1920 and the corresponding high in the QQQQ's to occur in the 47-48 range.
S&P

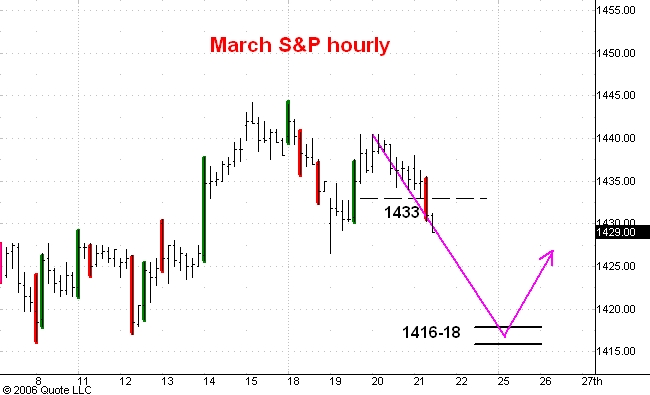
Here is an hourly chart of the March S&P e-mini futures which are trading about 11 points higher than the cash index. I last commented on this market here.
The low last Friday at 1419.75 was the low of a wide range down bar. There was no follow through selling so I think the buyers near the low of this down bar were longer time frame buyers. The fact that bids from this group came in above the 1416-18 support zone increases my confidence that the market will make an important low point at 1416 or perhaps a point or two lower.
The rally today will probably stop in the 1430-31 zone. This is the price area where longer time frame traders last sold agressively. You can see this from the green, wide range bar which was Friday's opening bar. This bar indicated longer time frame buying but there was no follow through buying. So the sellers near the high of this bar (1430) were longer time frame traders too.
After the market reaches the 1430-31 zone I think it will drop to 1416 or a tad lower. This low should then be followed by a rally to 1455 and higher.
Guesstimates on December 26, 9:15 am ET
March S&P Futures: The S&P’s should soon drop to support in the 1416-18 range and then begin a rally up to 1455 and higher.
March Bonds: The bonds should find temporary support in the 111-16 to 111-20 range. The market is headed down to 109-110 over the next few weeks.
March 10 Year Notes: The notes should find temporary support near 107-28. The market is headed down into the 105-106 range over the next few weeks.
Euro-US Dollar: I think that a move to 116 and lower has begun. Resistance above the market is at 132.50.
Dollar-Yen: The market is headed for temporary resistance at 122.00. Support today is at 118.50. I expect to see the yen trade at 130 in 2007.
February Crude: Resistance above the market is at 63.80. I expect crude to drop to 57.50.
February Gold: I think a big drop in gold is underway and will carry the market below 500. Short term support is 605 while resistance above the market is at 628.
March Silver: I think a big drop in silver is underway and will carry the market below 900. The 1195 level is now short term support and resistance above the market is at 1295.
Google: Google has entered the 450-55 support zone. The next significant move should be upward to 564.
Friday, December 22, 2006
S&P

Here is an hourly chart of the March S&P e-mini futures which trade about 11 points over the cash index. I last commented on this market here.
I think we shall see the S&P's trade in the 1416-18 zone early next week. Once the low occurs the market will then begin a move up to 1455 and evenutally higher than that.
T-bonds
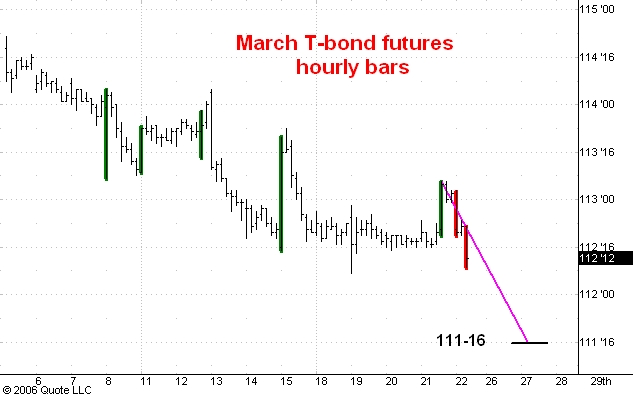
Here is an hourly chart of March T-bond futures. I last commented on this market here.
Today the market has put in two wide range down bars and this means it is headed for short term support near 111-16.
I have highlighted what I think is the most bearish feature of this chart. On five occasions over the past two weeks the market has put in a wide range up bar. These I have highlighted in green. In each case there was little or no follow through buying. This means that the sellers on these wide range up bars were predominantly longer time frame traders. This is especially bearish since these traders are "selling in the hole", i.e substantially below the 114-27 top of December 5. They evidently thing the bonds are going substatially lower from here. So do I. I think the market is headed down into the 109-110 range.
Guesstimates on December 22, 8:50 am ET
March S&P Futures: The S&P’s should soon drop to support in the 1416-18 range and then begin a rally up to 1455 and higher.
March Bonds: The bonds got close to resistance in the 113-12 to 113-16 range. They will probably reach that zone before the down trend to 109-110 resumes.
March 10 Year Notes: A rally to 108-26 is likely before the market resumes its drop inot the 105-106 range.
Euro-US Dollar: I think that a move to 116 and lower has begun. Resistance above the market today is at 132.50.
Dollar-Yen: I think a move to 121 and ultimately to 130 has begun. Support stands at 117.40.
February Crude: Resistance above the market is at 63.80. I expect crude to drop to 57.50.
February Gold: I think a big drop in gold is underway and will carry the market below 500. Short term support is 605 while resistance above the market is at 628..
March Silver: I think a big drop in silver is underway and will carry the market below 900. The 1195 level is now short term support and resistance above the market is at 1295.
Google: Google has entered the 450-55 support zone. The next significant move should be upward to 564.
Thursday, December 21, 2006
S&P
Here is an hourly chart of the March S&P e-mini futures which are trading about 11 points higher than the cash index. I last commented on this market here.
In this morning's guesstimate I said that I was abandoning my "down to 1416" scenario and instead looking for a low in the 1432-34 support zone which would be followed by a move up to 1455.
You can see that during the last hour the market has broken decisively below the 1432-34 support zone, putting in a wide range, high volume down bar. This represents aggressive selling by longer time frame traders, something I did not expect this morning. I don't think the market will find bids from longer time frame traders until it starts getting close to 1416-18 support. At those levels the drop from 1445 would about equal the length of the last two substantial reactions in this 6 month uptrend.
Once support in the 1416-18 zone is reached I expect the S&P's to start preparation for a move to 1455 and then to 1475.
Guesstimates on December 21, 8:50 am ET
March S&P Futures: I now think that the 1432-34 zone is again support and that the market is about to turn higher from there. I am abandoning my “down to 1416” scenario and instead looking for a move up to 1455 and then to 1475.
March Bonds: It still looks like the market will rally to 113-12 to 113-16 before the down trend to 109-110 resumes.
March 10 Year Notes: A rally to 108-26 is likely before the market resumes its drop inot the 105-106 range.
Euro-US Dollar: I think that a move to 116 and lower has begun. Resistance above the market today is at 132.50.
Dollar-Yen: I think a move to 121 and ultimately to 130 has begun. Support stands at 117.40.
February Crude: Resistance above the market is at 63.80. I expect crude to drop to 57.50.
February Gold: I think a big drop in gold is underway and will carry the market below 500. Short term support is 605 while resistance above the market is at 628..
March Silver: I think a big drop in silver is underway and will carry the market below 900. The 1195 level is now short term support and resistance above the market is at 1295.
Google: I now see support for Google in the 450-55 range. From there GOOG should begin a move up to 564.
Wednesday, December 20, 2006
S&P
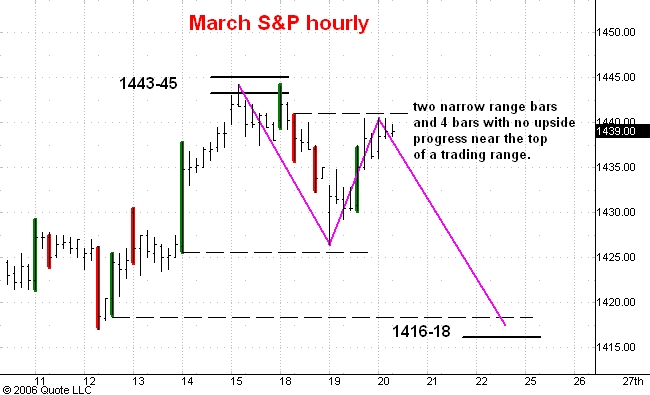
Here is an hourly chart of the March S&P e-mini futures which are now trading about 11 points above the cash index. I last commented on this market here.
The market has spent most of today trading above the 1438 level but below yesterday's late high at 1440.50. The S&P's are near the top of a 4 day trading range. The market has shown no follow through buying after two strong, wide range up bars yesterday afternoon. Over the past two hours the trading range has narrowed visibly.
Taken together these observations tell me that the market is going to head back down again. The strongest support is in the 1416-18 range. But there is now a good chance that the break will only carry down to 1431 or so and then be followed by a rally to new highs. I can't really tell which of these possiblities is the more likely one.
In any case I think the market is in a minor corrective phase and that in January we shall see a 1475 print.
Guesstimates on December 20, 8:50 am ET
March S&P Futures: The market closed below 1438 yesterday so I still think that a move down into the 1416-18 zone is likely. Strength above 1438 early today will mean that the market will go back to last week’s high at 1445 but then I would expect another drop to 1425 or so before the bigger uptrend resumes.
March Bonds: It still looks like the market will rally to 113-12 to 113-16 before the down trend to 109-110 resumes.
March 10 Year Notes: A rally to 108-26 is likely before the market resumes its drop inot the 105-106 range.
Euro-US Dollar: I think that a move to 116 and lower has begun. Resistance above the market today is at 132.50.
Dollar-Yen: I think a move to 121 and ultimately to 130 has begun. Support stands at 117.40.
February Crude: Resistance above the market is at 63.80. I expect crude to drop to 57.50.
February Gold: I think a big drop in gold is underway and will carry the market below 500. Short term support is 605 while resistance above the market is at 628..
March Silver: I think a big drop in silver is underway and will carry the market below 900. The 1195 level is now short term support and resistance above the market is at 1295.
Google: Yesterday Google broke below 475 support and now I think it will have to drop to 450 or so before a rally to 564 can begin.
Tuesday, December 19, 2006
S&P Update
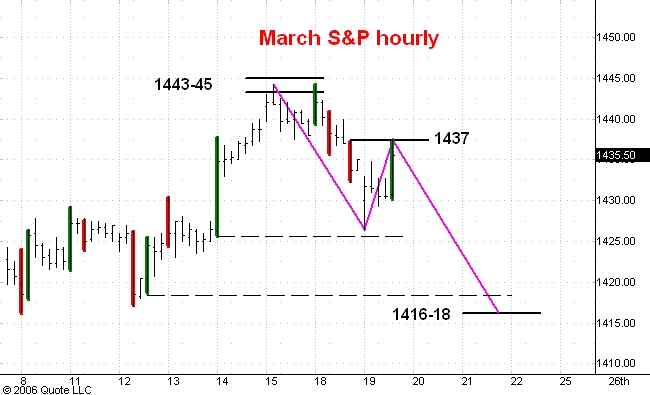
Here is an hourly chart of the March S&P e-mini futures which are trading about 12 points over the cash index. I commented on this market this morning.
The S&P's have rallied a little more than I expected. However they have reached 1437.50, the point at which longer time frame sellers took hold of the market yesterday, the high of the last red, wide range down bar. I expect these sellers to take advantage of this price again.
If I am right we shall soon see a drop into the 1416-18 range, especially since the rally from this morning's low already has a clear, three phase shape to it.
Any strength above 1438 and especially a close above that level would force me to abandon my "down to 1416-18" scenario. In any case I expect the market to advance to 1475 after this correction is complete.
Gold
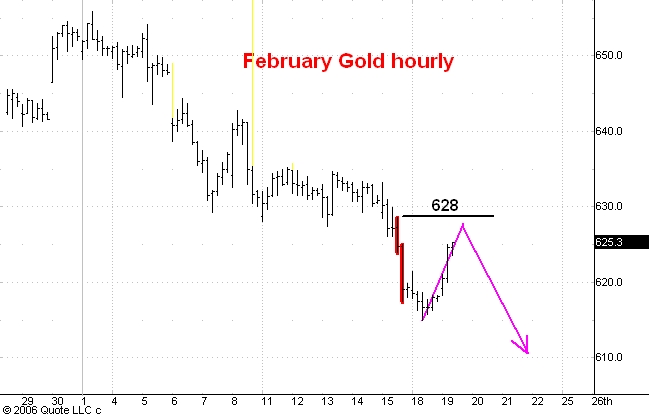
Here is an hourly chart showing pit trading in February gold futures. I last commented on this market here.
Notice the two consecutive down bars I have highlighted in red. These bars represent selling by longer time frame traders. The market only managed to drop another 2 dollars after the low of the second of these bars and this means that longer time frame buyers had entered the market.
When this happens the market has to rally to find more sellers. In this case I think we will see a rally about as big ($13) as the biggest rally on the way down from the 655 top. This would put the market close to the 628 level. Note that the high of the first red bar was also about 628. If longer time frame sellers took advantage of a price at 628 a few days ago it is reasonable to expect them to again sell if the market gets close to 628. So this is a second reason to expect resistance near 628.
The next step down should carry gold to 605. The market is still in the early stages of a drop which I expect to carry below the 500 level.
T-bonds

Here is an hourly chart of March T-bond futures. I last commented on this market here.
The PPI news this morning dropped the market sharply as you can see from the wide range down bar I have highlighted in red. But there was no follow-through selling so I conclude that longer time frame traders were buyers on the news. The market has to rally in order to find the longer time frame sellers who I think are currently in control of this market and will be for a few more weeks. My guess is that these sellers will enter in the 113-12 to 113-16 range which should prove to be resistance for this rally.
I expect the bonds to drop into the 109-110 range over the next few weeks.
S&P
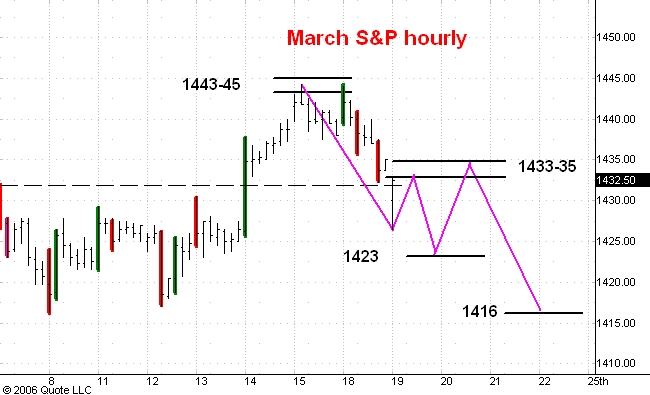
Here is an hourly chart of the March S&P e-mini futures which are trading about 12 points above the cash index. I last commented on this market here.
Before the pit open this morning the market dropped well below the 1432-34 support zone. This means that I was mistaken when I identified the buyers on the wide range down bar late yesterday as longer time frame traders.
I now think that a break of 3-5 trading days and about 30 points has started. A 30 point break would be as big as the late November and late October drops in the S&P.
I also think that the market will trade in a range with low at 1423 and high in the 1433-35 zone over the next day or two. The rough pattern I envision can be seen on the chart. Late this week or early next a drop to 1416 or a little lower should develop and this will end the reaction from 1445.
Once this correction is complete I expect the S&Ps to rally to 1465.
Guesstimates on December 19, 8:50 am ET
March S&P Futures: In early trading this morning the market traded as low as 1428.75 which is visibly below the 1432-34 support zone. Nonetheless I still think the S&P’s are putting in a low here and will soon begin an advance to 1455.
March Bonds:. Next short term support is at 111-24. The bonds are headed down into the 109-110 range
March 10 Year Notes: Next short term support is at 108-00. The notes are headed down into the 105-106 range.
Euro-US Dollar: I think that a move to 116 and lower has begun. Resistance above the market today is at 131.60.
Dollar-Yen: I think a move to 121 and ultimately to 130 has begun. Support stands at 117.40.
February Crude: Resistance above the market is at 63.80. I expect crude to drop to 57.50.
February Gold: I think a big drop in gold is underway and will carry the market below 500. Short term support is 605.
March Silver: I think a big drop in silver is underway and will carry the market below 900. The 1195 level is now short term support.
Google: Yesterday Google broke below 475 support and now I think it will have to drop to 450 or so before a rally to 564 can begin.
Monday, December 18, 2006
S&P Update
Here is an hourly chart of the March S&P e-mini futures which are currently trading about 12 points over cash. I last commented on this market this morning.
The S&P's have dropped into the 1432-34 support zone. Note that since the last post there have been two expanded range down bars which I have highlighted in red. These represent selling activity by longer time frame sellers. In this situation the issue is always who is on the other side of these trades.
I think that the most recent bar also represents buying by longer time frame traders. I have two reasons. First the market has dropped to the middle of the wide range breakout bar you see in green which moved the market above the 1432 level last Thursday. The longer time frame traders who caused this breakout now have another opporunity to buy at the same prices and I think they will take advantage of it. Secondly, the break from Friday's high of 1445 is now about 12 points and as such equals the size of the break on December 11-12. It has also brought the market to the lows of the trading range of the past three days. Price is therefore a little below short term value and this too gives longer time frame traders confidence to buy.
I think the next development will be a rally to 1455.
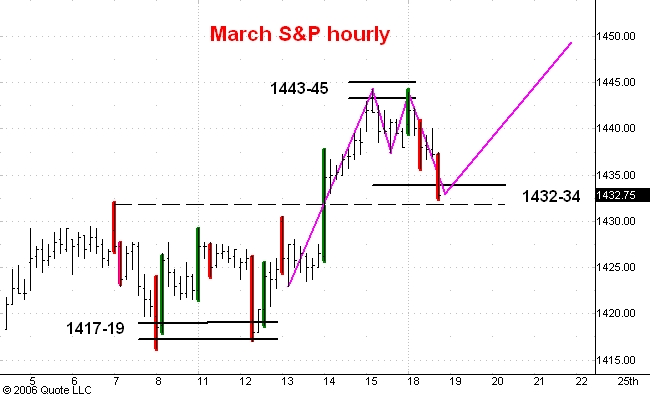
S&P

Here is an hourly chart of the March S&P e-mini futures. These are trading about 12 points over the cash index. I last commented on this market here.
Notice the green bar showing the opening hour of pit trading today. It was wider than any bar Friday and the market closed in the upper half of the bar. Normally such activity indicates buying by longer time frame traders and selling by short time frame traders. But today there was no follow through to the longer time frame buying activity and this tells me that the sellers were longer time frame traders as well.
I interpret this to mean that the market will have to break a little bit more to find more bids from longer time frame traders. I estimate that this support will be found in the 1432-34 range today and tomorrow. In any case I still think the next signficant development will be a rally to 1455.
Oil Service HOLDRS

Here is a daily bar chart of Oil Service HOLDRS. I last commented on this ETF here.
I think OIH has begun a move which will eventually take it to 100 or below. Meantime I expect short term support to show up in the 131-33 zone. After a 7 or 8 point rally from there the market should resume its drop to 118 and below.
Guesstimates on December 18, 8:50 am ET
March S&P Futures: Support below the market today is at 1437 but I suspect the S&P’s will dip into the 1432-34 zone at least one time this week before the market can rally to 1455.
March Bonds: The bonds are headed down into the 109-110 range. Next short term support is at 111-24.
March 10 Year Notes: The notes are headed down into the 105-106 range. Next short term support is at 108-00.
Euro-US Dollar: I think that a move to 116 and lower has begun. Resistance above the market today is at 131.60.
Dollar-Yen: I think a move to 121 and ultimately to 130 has begun. Support stands at 117.40.
February Crude: Switching to the February contract today which trades about 60 cents over January. Resistance above the market is at 63.80. I expect crude to drop to 57.50.
February Gold: I think a big drop in gold is underway and will carry the market below 500. Short term support is 605.
March Silver: I think a big drop in silver is underway and will carry the market below 900. The 1245 level is short term support.
Google: Last January’s top at 475 is now support and I expect Google to soon resume its rally to 564.
Friday, December 15, 2006
S&P

Here is an hourly chart of the March S&P e-mini futures. The futures are trading about 12 points above cash right now. I last commented on this market here.
After the CPI number came out this morning the market rallied to 1445.00 in electronic trading but during pit trading has only made it as high as 1444.25.
A rally to resistance on news followed by a couple of hours of sideways action is usually a sign of longer time frame trader selling at resistance. In this instance I don't see much aggressive selling since the hourly ranges remain narrow. So I think we shall see a mild reaction down into the 1437-39 range followed by a renewed rally to 1455 or so.
One of the most remarkable (and unusual) features of this advance is the narrow hourly ranges that have become the norm. Narrow ranges do not indicate any aggressive longer term time frame selling. So the implication is that, normal reactions aside, this market is headed even higher.
The 1511 target for the cash S&P which is projected by my box theory is looking more and more plausible
Guesstimates on December 15, 8:50 am ET
March S&P Futures: The S&P’s rallied into the 1443-45 resistance zone on the CPI news about 15 minutes ago. There is still no sign of even a 10 point break yet. Support below the market is at 1437 while the next resistance above the market is at 1455.
March Bonds: The bonds rallied on the CPI news right up to resistance at 113-18. I think the market will stall here and head lower.
March 10 Year Notes: The notes rallied on the CPI news but resistance is at 108-30. The market should stall there and then head lower.
Euro-US Dollar: I think that a move to 116 and lower has begun. Resistance above the market is at 132.00.
Dollar-Yen: I think a move to 121 and ultimately to 130 has begun. Support stands at 117.40.
January Crude: Resistance above the market is at 63.25. I expect crude to drop to 57.50.
February Gold: Gold should rally to 662. Any weakness below 620 would cancel this prognosis and mean that an extended drop has begun.
March Silver: I think silver is headed for 1450-1460. After that I shall be expecting a drop below 940.
Google: Last January’s top at 475 is now support and I expect Google to resume its rally to 564.
Thursday, December 14, 2006
S&P Update

Here is an hourly chart of the March S&P e-mini futures. (This contract is trading about 12 points higher than the cash S&P index). I last commented on this market here.
After the aggressive buying evidenced by the wide range up bar for today's opening hour the market has quieted and has been trading sideways in a narrow range.
I think the buying this morning came from longer time frame traders and investors. Their orders were filled by short horizon day traders. Before the day is over these short time frame traders will probably get tired of sitting with break even or losing trades. To flatten out their postions they will have to bid the market higher. So I expect the S&P's to finish the day on their highs, probably quite close to or in the 1443-45 resistance zone.
S&P
Here is an hourly chart of the March S&P futures. I last commented on this market here.
The market is breaking out of its recent trading range on high volume. The trading so far during the opening hour is shown in the last bar highlighted in green.
I think the sideways action in the trading range was subtantial enough and the buying so far aggressive enough to make the 1443-45 range a more plausible resistance zone than 1437-39. Meantime support is at 1431.
Those of you who track the cash S&P should subtract 12 points from these numbers to convert from the March futures to cash.
Guesstimates on December 14, 8:50 am ET
March S&P Futures: The market is headed for resistance in the 1437-39 zone.
March Bonds: The bonds are headed for the 109-110 zone. Support today is at 111-24.
March 10 Year Notes: The notes are headed for the 105-106 zone. Support today is at 108-00.
Euro-US Dollar: I think that a move to 116 and lower has begun. Resistance above the market is at 133.10.
Dollar-Yen: I think a move to 121 and ultimately to 130 has begun.
January Crude: Resistance above the market is at 63.25. I expect crude to drop to 57.50.
February Gold: Gold should rally to 662. Any weakness below 620 would cancel this prognosis and mean that an extended drop has begun.
March Silver: I think silver is headed for 1450-1460. After that I shall be expecting a drop below 940.
Google: Last January’s top at 475 is now support and I expect Google to resume its rally to 564.
Wednesday, December 13, 2006
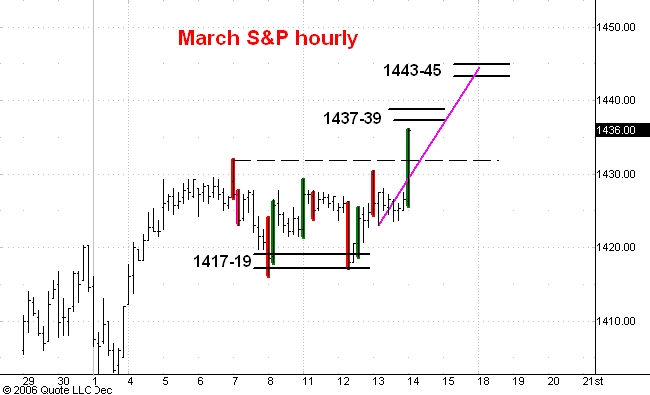
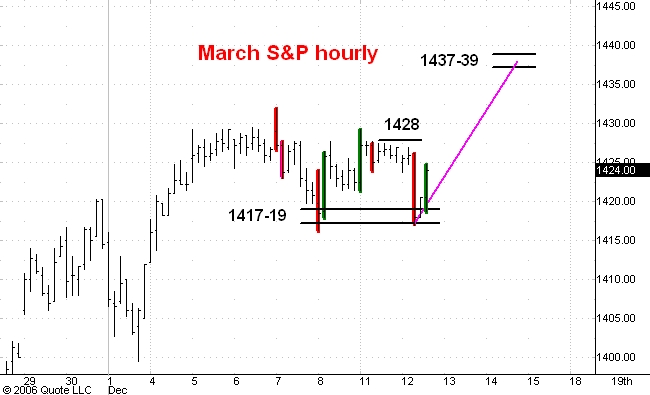
S&P Update

Here is an hourly chart of the March S&P e-mini futures. I last commented on this market this morning.
As you can see there has been no follow through selling subsequent to today's opening wide range bar. This tells me that the buyers during that opening bar were in fact longer time frame traders. The last buying by these longer time frame traders started at the low of the last green bar you seen on the chart. This was below the 1420 level so we see that the longer time frame traders have raised their bids.
This is a very bullish development and tells me that the market is about to move above the 1432 level to resistance in the 1437-39 zone.
iShares 20 Year Bond ETF
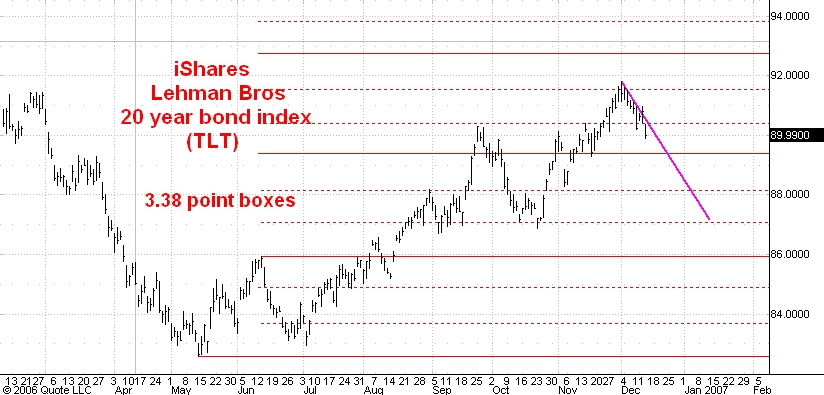
Here is a daily chart of the Lehman Bros. 20 year bond index ETF. I last commented on this fund here.
I think the market has begun a drop that will carry it to 87.00 or so over the next few weeks. This is still a bull market however and once this decline is complete I shall be expecting a move up to 95 and higher.
T-bonds

Here is an hourly bar chart of March T-bond futures. I last commented on this market here.
As you can see the market has broken below support at 113-04. The opening hour today was a wide range down bar reflecting aggressive selling in response to the retail sales number. The significant observation is that the market has continued downward after that opening bar. The consequent deduction is that the buyers were all short term time frame buyers. This means that the market must go lower to find longer time frame buyers before it can rally significantly.
I think the bonds have begun a move down to 110 or even a little lower than that. I expect today's break to continue down to 111-24 before we see a rally of as much as a point.
Oil Service HOLDRS
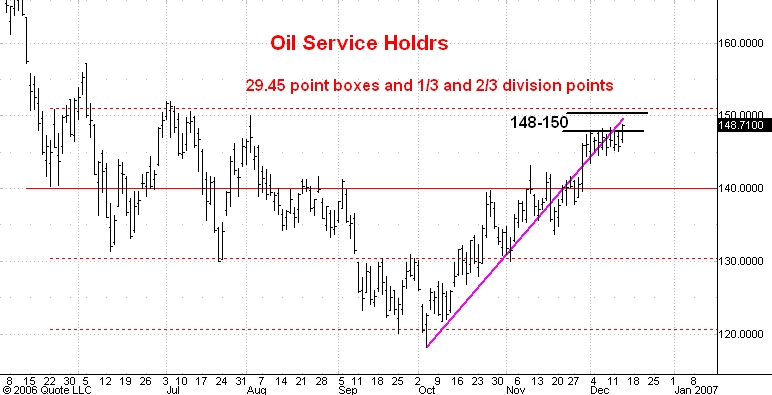
Here is a daily chart of Oil Service HOLDRS. I last commented on this ETF here.
Today OIH is rallying well into the 148-50 resistance area. I think this is the last gasp of the rally from the October 4 low at 118.19. The next big move will be downward to 100.
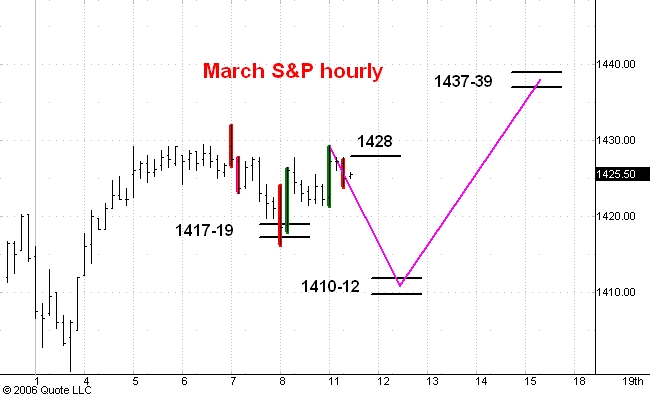
S&P
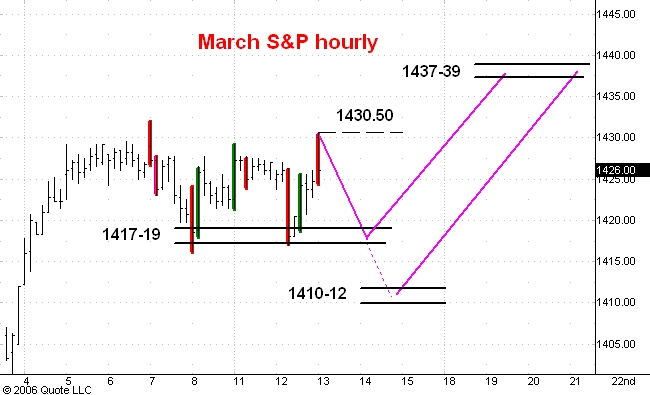
Here is an hourly chart of the March S&P e-mini futures. I last commented on this market here.
The retail sales news this morning pushed the market to the top of its recent trading range, but this advance encouraged a large volume of aggressive selling which increased as the market dropped away from its high.
I think this means that the S&P's are headed back down to support near 1417 and there is an even chance that the reaction will continue even lower to support in the 1410-12 range.
In any case I think that once this correction is complete we shall see the S&P's trade in the 1437-39 range soon after.
Guesstimates on December 13, 8:35 am ET
March S&P Futures: The market is headed for resistance in the 1437-39 zone.
March Bonds: The bonds are headed for 116-00. After that rally a break of 5 points or so will become likely.
March 10 Year Notes: The notes should rally to 110-16. Support stands at 108-14.
Euro-US Dollar: I think that a move to 116 and lower has begun. Resistance above the market is now at 133.10.
Dollar-Yen: I think a move to 121 and ultimately to 130 has begun.
January Crude: I expect crude to drop to 57.50 and then rally back to 63.00.
February Gold: Gold should now rally to 662. Any weakness below 620 would cancel this prognosis and mean that an extended drop has begun.
March Silver: I think silver now is headed for 1450-1460. After that I shall be expecting a drop below 940.
Google: Last January’s top at 475 is now support and I expect Google to resume its rally to 564.
Tuesday, December 12, 2006
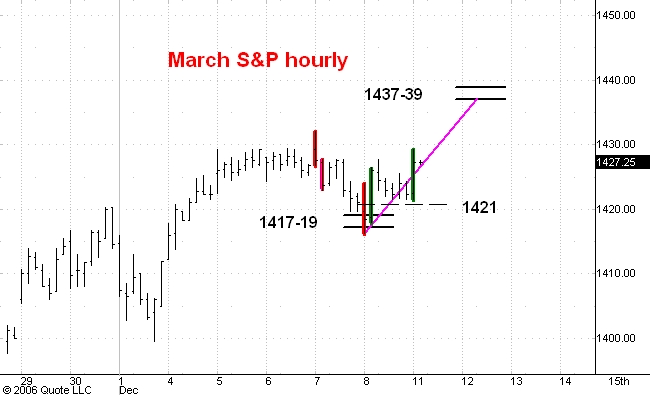
S&P Update
Here is an hourly chart of the March S&P e-mini futures. I commented on this market earlier today.
As you can see the market is putting in a wide range up hour in reponse to the Fed's decision to leave rates unchanged. Note that there was no follow through to the preceeding wide range down hour and the low of that down hour was on support. Morover the market has retraced nearly all of that hour's break during the current wide range up hour.
This tells me that the 1417-19 support zone is being aggressively defended by longer time frame bulls. I conclude that the market is now headed for 1437-39 resistance.
Crude Oil
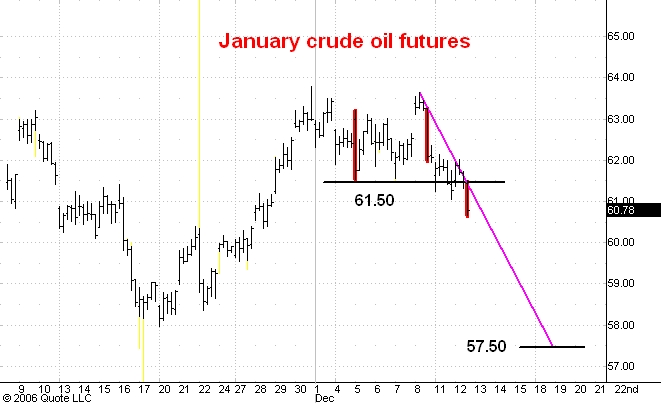
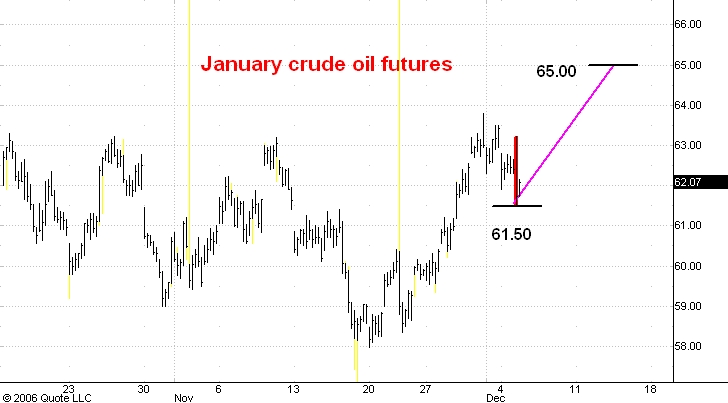
Here is an hourly chart of January crude oil futures. I last commented on this market here.
You can see that the market is putting in a wide range down bar almost entirely below the 61.50 support level. I think this means that January crude is headed down to 57.50. However, I do not think that the market will go much lower than that I from there I will be expecting a rally back to the top of the current trading range.
S&P

Here is an hourly chart of the March S&P e-mini futures. I last commented on this market here.
During the past hour there has been quite a bit of aggressive selling as evidenced by the wide range down bar I have highlighted in red.
I still think the market will continue down to support in the 1410-12 range before starting a rally to 1437-39.
Guesstimates on December 12, 8:50 am ET
March S&P Futures: The market is now headed for support in the 1410-12 zone. From there it should rally to 1437-39.
March Bonds: The bonds should hold support near 113-04. The next development should be a rally to 116-00. After that rally a break of 5 points or so will become likely.
March 10 Year Notes: The notes should rally to 110-16. Support stands at 108-14.
Euro-Dollar: I still think that a move to 116 and lower has begun. Resistance above the market is now at 132.50.
Dollar-Yen: I think a move to 121 and ultimately to 130 has begun.
January Crude: Crude is trading a little below support at 61.50 but I still think the market is likely to rally into the 65.00-66.00 range before a substantial break begins.
February Gold: Gold should now rally to 662. Any weakness below 620 would cancel this prognosis and mean that an extended drop has begun.
March Silver: I think silver now is headed for 1450-1460. After that I shall be expecting a drop below 940.
Google: Last January’s top at 475 is now support and I expect Google to resume its rally to 564.
Monday, December 11, 2006
S&P Update
Here is an hourly chart of the March S&P e-mini futures. I commented on this market earlier today.
I had thought that the wide range up bar which opened today's pit session would develop into a breakout above 1432. But so far there has been no follow through. Note that there was no follow through to the last wide range up bar Friday morning and that right now the market is even trading below the high of that bar.
All in all we have seen aggressive buying on two distinct occasions the past two trading days but the market has not been able to rally further. This suggests that the sellers were not day traders but rather longer time frame traders and this means that the market can't rally until it finds more long time frame buyers. To find these buyers the market will have to break first.
The entire rally from Friday's lows now looks like a completed three phase rally. The past hour was an expanded range down hour. If this indicates upcoming aggressive selling as I think it does then the market should not now trade higher than 1428 since the high of the bar was 1427.75.
All these considerations lead me now to expect a drop into the 1410-12 range. Such a drop would be about 20 points from the 1432 high and make this reaction equal in length to the November 30-December 1 drop.
After the market reaches support in the 1410-12 zone I expect it to move up to 1437-39.
Guesstimates on December 11, 8:50 am ET
March S&P Futures: I expect Friday’s low at 1416.25 to hold. The next swing upward should take the S&P’s into the 1437-39 zone.
March Bonds: The bonds should hold support near 113-04. The next development should be a rally to 116-00. After that rally a break of 5 points or so will become likely.
March 10 Year Notes: The notes should rally to 110-16. Support stands at 108-14.
Euro-US Dollar: I still think that a move to 116 and lower has begun. Resistance above the market is now at 132.50.
Dollar-Yen: I think a move to 121 and ultimately to 130 has begun.
January Crude: Crude has a good chance of extending its rally to 65.00. Support is still at 61.50.
February Gold: Gold should now rally to 662. Any weakness below 620 would cancel this prognosis and mean that an extended drop has begun.
March Silver: I think silver now is headed for 1450-1460. After that I shall be expecting a drop below 940.
Google: Last January’s top at 475 is now support and I expect Google to resume its rally to 564.
Friday, December 08, 2006
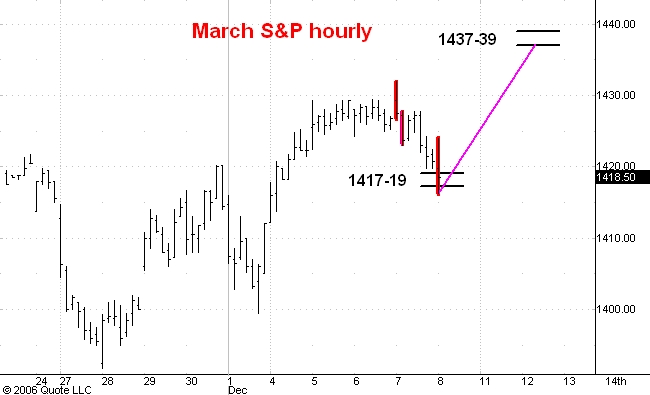
S&P Update

Here is an hourly bar chart of the March S&P e-mini futures. I commented on this market earlier this morning.
I thought that the opening hour would be an exhaustion bar because of its wide range and high volume to the downside with its low on support. The next bar (highlighted in green) was an up bar with and even bigger range and volume almost as big as the opening bar. This tells me that this morning's low at 1416.25 will hold and that the market is headed up to resistance in the 1437-39 range.
For the rest of today I think the S&P's will hold support which I estimate is at 1421 near yesterday's close.
S&P
Here is an hourly chart of the March S&P e-mini futures. I last commented on this market here.
Today's opening hour is a wide range down bar. The low is at 1416.25, just a little below the low edge of the 1417-19 support zone.
I think this wide range, high volume bar will prove to be an exhaustion bar. The 1416.25 level should then not be broken by more than a couple of ticks. The next swing will carry the market upward into the 1437-39 resistance zone.
Guesstimates on December 8, 8:50 am ET
March S&P Futures: The market reached support in the 1417-19 zone earlier this morning and I think the next development will be an advance into the 1437-39 zone.
March Bonds: The bonds broke on the employment number to 113-07 but I think that level will hold. The next development should be a rally to 116-00. However, the next 5 points in this market will be downward from here.
March 10 Year Notes: The notes should rally to 110-16. Support stands at 109-00.
Euro-US Dollar: I still think that a move to 116 and lower is imminent.
Dollar-Yen: I think a move to 121 and ultimately to 130 has begun.
January Crude: Crude has a good chance of extending its rally to 65.00. Support is still at 61.50.
February Gold: Gold dropped a little below 633 support yesterday but I think the market is about to rally to the 662 target. After that I shall be expecting a drop below 540.
March Silver: I think silver now is headed for 1450-1460. After that I shall be expecting a drop below 940.
Google: Last January’s top at 475 is now support and I expect Google to resume its rally to 564.
Thursday, December 07, 2006
Crude Oil

Here is an hourly chart showing pit trading in January crude oil futures. I last commented on this market here.
Support at 61.50 is holding and I think the upside potential has been increased by the last two days' trading between 61.50 and 63.00. I think the market has a good chance to rally to 66.00, about a dollar higher than I originally expected. In any case I still believe that we shall see crude selling at $50 or lower during the first half of 2007.
S&P Update
Here is an hourly chart of the March S&P e-mini futures. I commented on this market earlier this morning.
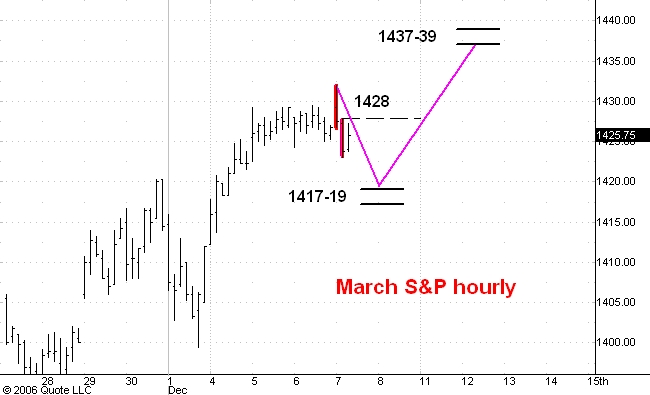
I still think the S&P's are headed down into the 1417-19 zone before they rally to 1437. I see resistance right now at 1428 and expect the market to rally near there and then to drop to its support zone of 1417-19.
S&P

Here is an hourly chart of the March S&P e-mini futures. I am switching to the March contract today from December. March trades 12 points over December so adjust the numbers in my recent S&P posts accordingly. I last commented on this market here.
I thought the market was about to rally to 1437. After breakout out from the trading range of the past two days the S&P's got as high as 1432. Then the bears started selling aggressively. You can see this selling in the last two bars on the chart which cover the 90 minutes of trading since the pit open.
I think this means the reaction I had been expecting but gave up on earlier this week has started. I think the market will drop to support which I see in the 1417-19 range. Then I shall be looking for a rally to 1437 or so.

Guesstimates on December 7, 8:50 am ET
March S&P Futures: Switching to the March contract today which trades 12 points over December. I think the market is headed for 1437 and then will react back down into the 1420-25 zone.
March Bonds: Support stands at 113-30 and from there the market should rally to 115-16. However, the next 5 points in this market will be downward from here.
March 10 Year Notes: The notes should rally to 110-16. Support stands at 109-00.
Euro-US Dollar: I still think that a move to 116 and lower is imminent.
Dollar-Yen: I think a move to 121 and ultimately to 130 has begun.
January Crude: Crude has a good chance of extending its rally to 65.00. Support is still at 61.50.
February Gold: Gold reached 633 support after yesterday’s pit close. I think that the market will now rally up to the 662 target.
March Silver: Silver dropped as low as 1361 after yesterday’s pit close but still has not reached 1350 support. However the market has rallied more than 20 cents off of its low so I think it now is headed for 1450.
Google: Last January’s top at 475 is now support and I expect Google to resume its rally to 564.
Wednesday, December 06, 2006
S&P
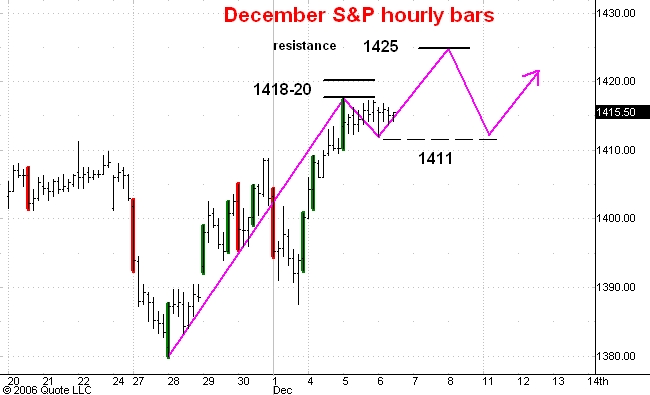
Here is an hourly bar chart of the December S&P e-mini futures. I last commented on this market yesterday.
Remember that the March '07 contract becomes the front month contract tomorrow morning. March is trading 12 point over December so tomorrow you will have to adjust the price levels I cite today accordingly.
I thought the market had started a reaction from its 1417.50 high yesterday and expected a drop to 1405 or so. Instead we have seen sideways trading in a narrow range entirely above the last breakout point which is the 1411.25 high printed on November 22.
This is a situation in which the market is deviating from a short term forecast for a drop to 1405. Since the bigger trend is up in any case I am forced to conclude that the S&P's will advance to 1425 or so from current levels before a reaction of as much as 10 points develops.
My best guess as to the market's course over the next few days is illustrated on the chart above.
The New York Times : Bearish to the Bone
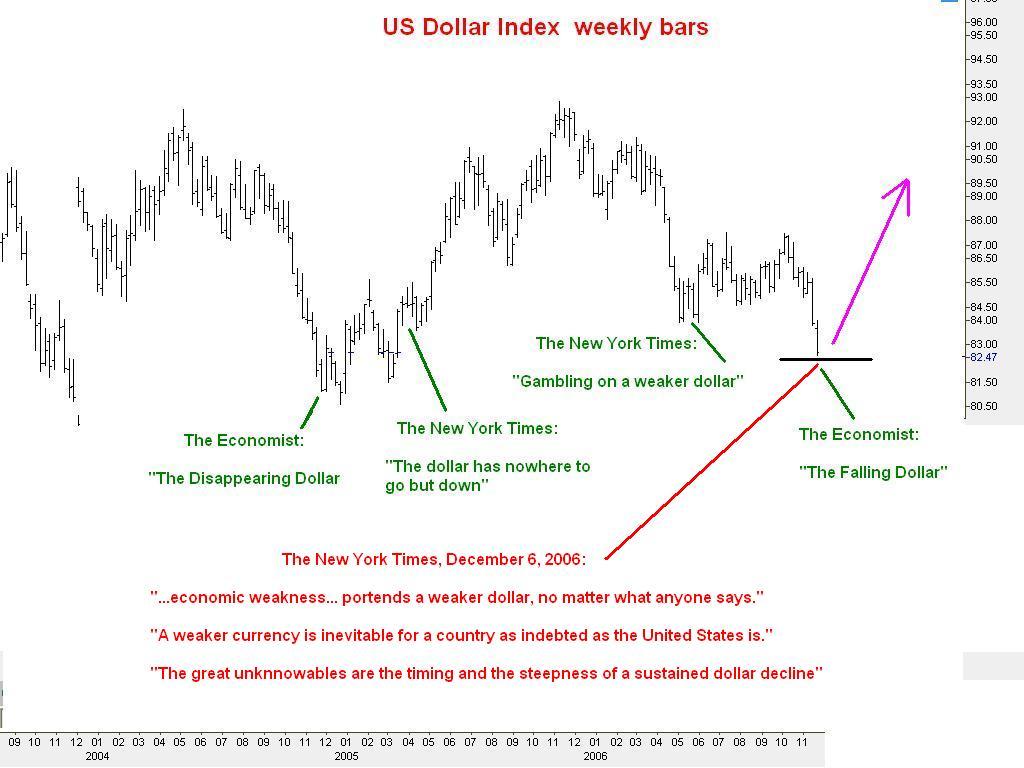
Here is the weekly bar chart of the US Dollar Index which I showed you in this post a couple of days ago.
Much to my surprise the New York Times this morning published an unequivocally bearish editorial on the dollar. This editorial is similiar to the one they published in early April 2005 and upon which I commented in this post.
Today the Times tells us:
"Investors remain largely focused on economic weakness in the United States and gathering strength in Europe - which portend a weaker dollar, no matter what anyone says."
"A weaker currency is inevitable for a country as indebted as the United States is."
"The great unknowables are the timeing and steepness of a sustained dollar decline."
The New York Times is an exquisitely bad market timer. This editorial reinforces my conviction that the dollar index will hit 100 before it hits 80.
Guesstimates on December 6, 8:50 am ET
December S&P Futures: The market is stalling just shy of the 1418-20 resistance zone. I think it will drop to 1405 or so before the advance resumes.
March Bonds: Support stands at 113-30 and from there the market should rally to 115-16. However, the next 5 points in this market will be downward from here.
March 10 Year Notes: The notes should rally to 110-16. Support stands at 109-00.
Euro-US Dollar: I still think that a move to 116 and lower is imminent.
Dollar-Yen: I think a move to 121 and ultimately to 130 has begun.
January Crude: Crude has a good chance of extending its rally to 65.00. Support is still at 61.50.
February Gold: The upside target is 662. Support stands at 633.
March Silver: I think the market is headed for 1450. Meantime support is at 1350.
Google: Last January’s top at 475 is now support and I expect Google to resume its rally to 564.
Tuesday, December 05, 2006
Crude Oil
Here is an hourly chart of January '07 crude oil futures. I last commented on this market here.
The market has dropped to support that I estimate stands near 61.50. Note the wide range down bar which carried the market to this support level. So far there has been no follow through to this selling. Since the market hit support I am willing to bet that this was an exhaustion bar and that the next development will be a rally to 65.00
T-bonds

Here is an hourly chart of March T-bond futures. I last commented on this market here.
I think the market is nearing the end of a corrective phase which will find support near 113-30. This would make this correction as big as the last one (highlighted in red). The next development should be a rally to 115-16.
I see a lot of short term bullishness in the bond market. This is one reason why I think the next move of 5 points or so from current levels will be downward.
S&P

Here is an hourly chart of the December S&P e-mini futures. I last commented on this market here.
The market has traded as high as 1417.50 this morning, a little shy of the 1418-20 resistance zone. But I do see a wide range up bar at the top of a big rally. This was a high volume hour stimulated by the release of the purchasing managers' report at 10am ET.
I think this wide range, high volume up bar on news just below resistance is telling us that the up trend has reached a temporary exhaustion point. I think the market is about to drop to 1405 or so and then will begin another rally which will carry it close to today's high.
S&P Bull Market Boxes

Here is a weekly bar shart of the cash S&P 500 index showing the entire bull market thus far. This bull market started from a low at 768 in October 2002. I last commented on this chart here.
As you can see the market has reached the 1/2 point of the fourth box. For the past six months this has been my target for the end of the bull market. But as I have remarked in this post and in this one I still do not see any convincing sign that the move up from the June-July lows is complete. So my box theory says that the next stopping point for the index will be the top of the current box near 1511. I think we shall see this level sometime during the first quarter of 2007.
Guesstimates on December 5, 8:50 am ET
December S&P Futures: The market is headed for 1418-20. Support today is at 1405.
March Bonds: The bonds have traded within 2 ticks of the 115 target. I think they will probably move up to 116-00. However, the next 5 points in this market will be downward from here.
March 10 Year Notes: The notes should rally to 110-16. Support stands at 109-00.
Euro-US Dollar: The market has moved past the 131.50-132.00 resistance zone but I still think that a move to 116 and lower is imminent.
Dollar-Yen: The yen has dropped as low as 114.42 this morning but I think a move to 121 and ultimately to 130 will begin soon.
January Crude: Crude has a good chance of extending its rally to 65.00. Support is at 61.50.
February Gold: The upside target is 662. From there I think an extended drop will start.
March Silver: I think the market is now headed for 1450.
Google: Last January’s top at 475 is now support and I expect Google to resume its rally to 564.
Monday, December 04, 2006
Advancing Issues
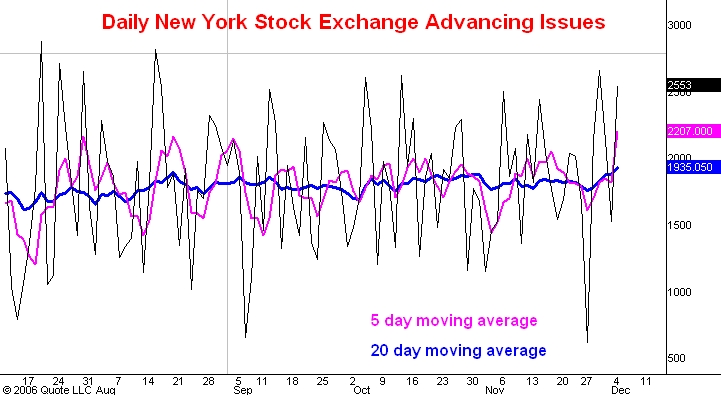
Here is a line chart showing the daily count of the number of issues traded on the New York Stock Exchange which advance in price (black line). Also shown are the five day (purple line) and 20 day (blue line) moving averages of this number. I last commented on this indicator here.
Today with less than an hour to go in the trading day both of these moving averages have reached the highest levels they have recorded since the June-July low points this year. This has two implications.
First it is solid evidence that the bearish divergences this indicator typically shows near an important top are absent as I asserted in this post.
Morover, the fact that The 20 day moving average has reached new highs for the upmove also implies that this rally has at least two more months and possibly 4 more months to run. See my comments on this phenomenon in this post.
The US Dollar


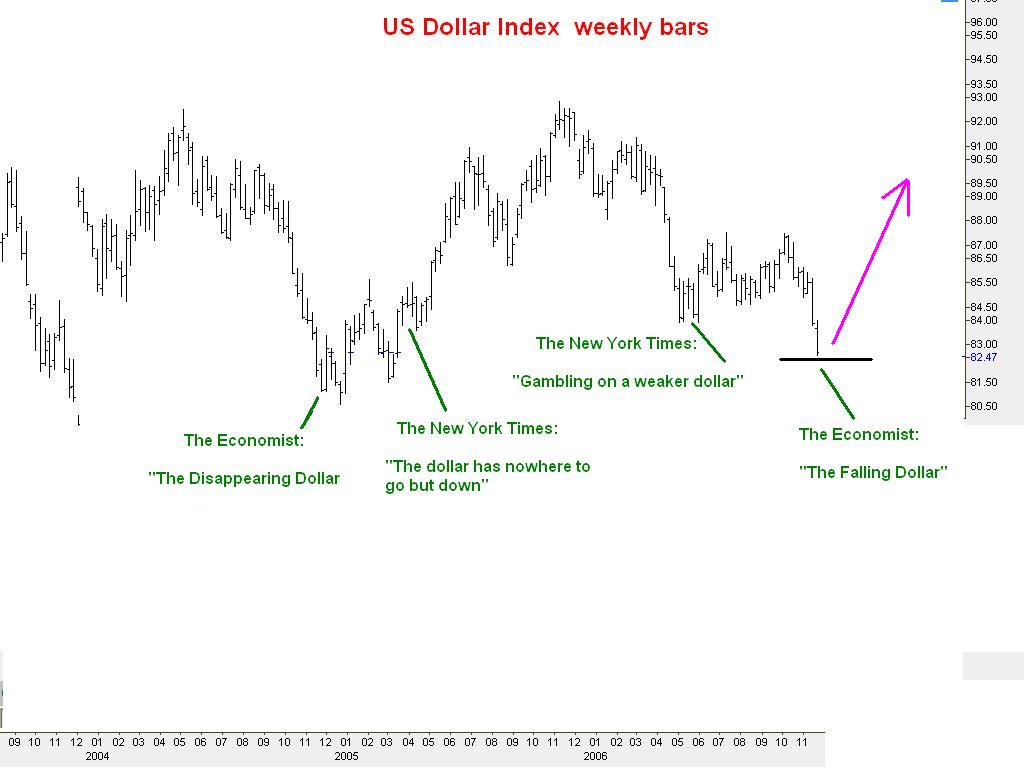
Above this post you see a weekly bar chart of the US dollar index. (Ignore the bars on the far left hand side of the chart; they are the residue of an editing mistake!). Above this chart are pictures of two covers from the Economist Magazine. The top one shows the December 4, 2004 cover while the other is the cover of the latest issue of the Economist.
Over the past two years the mainstream media have been emphatically bearish on the US dollar. This sentiment is currently shared by virtually everyone I talk to and by almost all economic commentators I read or hear.
On the weekly bar chart of the dollar I have marked the point in December 2004 at which The Economist came out with a bearish US dollar cover. About 4 months later the New York Times weighed in with a highly unusual and unequivocal editorial announcing that "the dollar has nowhere to go but down". You can see what happened over the following 8 months.
I think the market is now in a similar situation. This time the New York Times beat The Economist to the punch with its May 20, 2006 editorial "Gambling on a Weaker Dollar". And The Economist has just now added its weight to the pile of bearish opinion.
I see support for the dollar index at 82.50. I think the market is about to begin an 18 month move up to 100.
S&P

Here is an hourly chart of the December S&P e-mini futures. I last commented on this market here.
The rally off of the Friday afternoon low at 1387.50 has been a vigorous one. I think the market has started its move into the 1418-20 zone. (NOTE: when we switch into the March '07 contract the target zone will be 1430-32 because March is trading about 12 points over December).
Today I think the S&P's will find support near 1399, just a tad below Friday's close at 1400.25.
Subscribe to:
Posts (Atom)