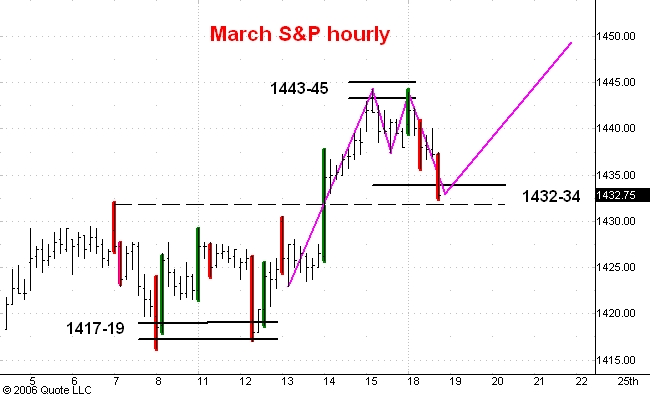
Here is an hourly chart of the March S&P e-mini futures which are currently trading about 12 points over cash. I last commented on this market this morning.
The S&P's have dropped into the 1432-34 support zone. Note that since the last post there have been two expanded range down bars which I have highlighted in red. These represent selling activity by longer time frame sellers. In this situation the issue is always who is on the other side of these trades.
I think that the most recent bar also represents buying by longer time frame traders. I have two reasons. First the market has dropped to the middle of the wide range breakout bar you see in green which moved the market above the 1432 level last Thursday. The longer time frame traders who caused this breakout now have another opporunity to buy at the same prices and I think they will take advantage of it. Secondly, the break from Friday's high of 1445 is now about 12 points and as such equals the size of the break on December 11-12. It has also brought the market to the lows of the trading range of the past three days. Price is therefore a little below short term value and this too gives longer time frame traders confidence to buy.
I think the next development will be a rally to 1455.
1 comment:
Carl,
You are simply excellent in your analysis (even thought not always right--who is?) and one of the best teachers in the trading field.
Thank You, Victor
Post a Comment