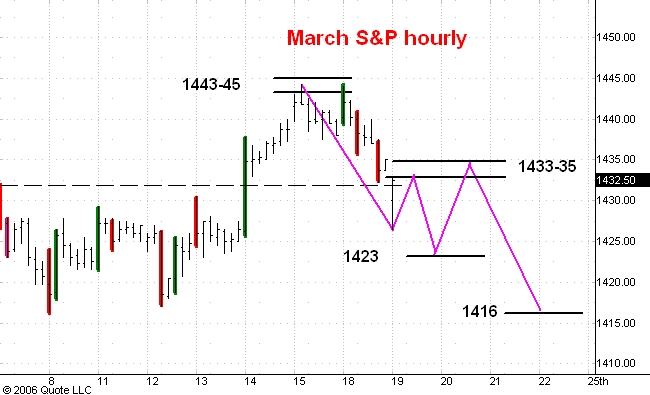
Here is an hourly chart of the March S&P e-mini futures which are trading about 12 points above the cash index. I last commented on this market here.
Before the pit open this morning the market dropped well below the 1432-34 support zone. This means that I was mistaken when I identified the buyers on the wide range down bar late yesterday as longer time frame traders.
I now think that a break of 3-5 trading days and about 30 points has started. A 30 point break would be as big as the late November and late October drops in the S&P.
I also think that the market will trade in a range with low at 1423 and high in the 1433-35 zone over the next day or two. The rough pattern I envision can be seen on the chart. Late this week or early next a drop to 1416 or a little lower should develop and this will end the reaction from 1445.
Once this correction is complete I expect the S&Ps to rally to 1465.
No comments:
Post a Comment