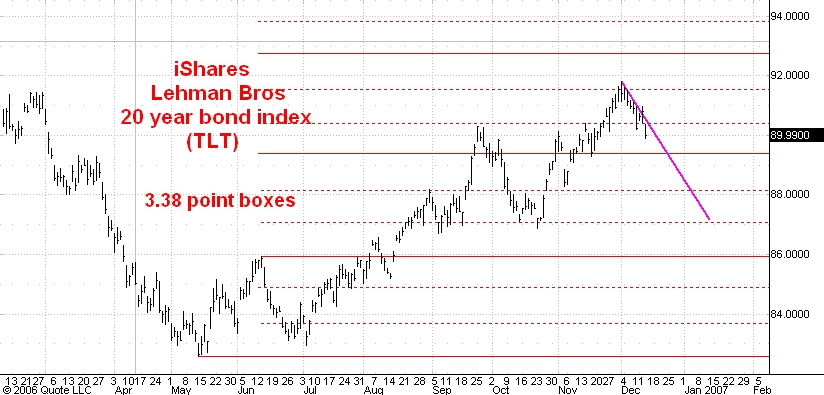
Here is a daily chart of the Lehman Bros. 20 year bond index ETF. I last commented on this fund here.
I think the market has begun a drop that will carry it to 87.00 or so over the next few weeks. This is still a bull market however and once this decline is complete I shall be expecting a move up to 95 and higher.
No comments:
Post a Comment