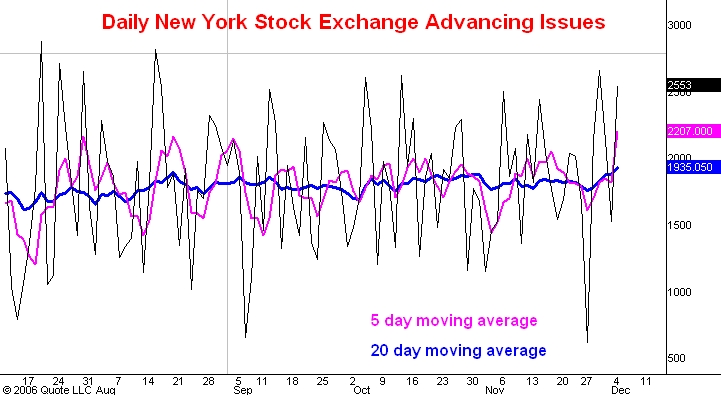
Here is a line chart showing the daily count of the number of issues traded on the New York Stock Exchange which advance in price (black line). Also shown are the five day (purple line) and 20 day (blue line) moving averages of this number. I last commented on this indicator here.
Today with less than an hour to go in the trading day both of these moving averages have reached the highest levels they have recorded since the June-July low points this year. This has two implications.
First it is solid evidence that the bearish divergences this indicator typically shows near an important top are absent as I asserted in this post.
Morover, the fact that The 20 day moving average has reached new highs for the upmove also implies that this rally has at least two more months and possibly 4 more months to run. See my comments on this phenomenon in this post.
1 comment:
Carl, could you update on the bull market boxes projection for S&P cash index? Wouldnt a half/full box above 1410 take the index to 1500 or 1600 zone?
Thanks again for your time and great work!
Post a Comment