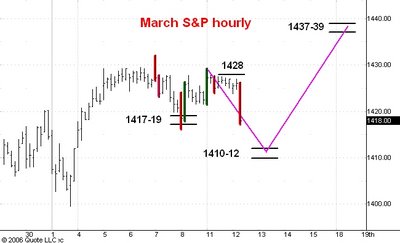
Here is an hourly chart of the March S&P e-mini futures. I last commented on this market here.
During the past hour there has been quite a bit of aggressive selling as evidenced by the wide range down bar I have highlighted in red.
I still think the market will continue down to support in the 1410-12 range before starting a rally to 1437-39.
No comments:
Post a Comment