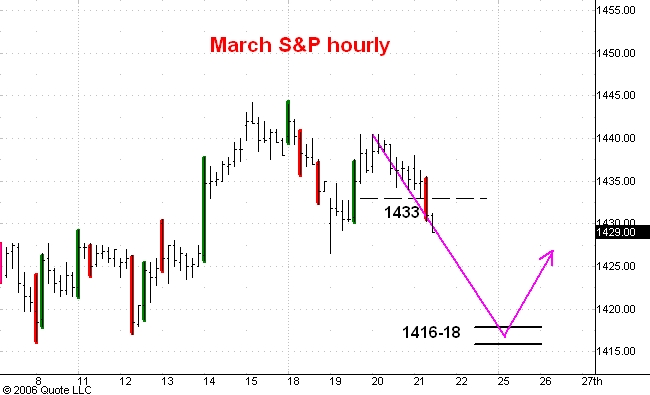
Here is an hourly chart of the March S&P e-mini futures which are trading about 11 points higher than the cash index. I last commented on this market here.
In this morning's guesstimate I said that I was abandoning my "down to 1416" scenario and instead looking for a low in the 1432-34 support zone which would be followed by a move up to 1455.
You can see that during the last hour the market has broken decisively below the 1432-34 support zone, putting in a wide range, high volume down bar. This represents aggressive selling by longer time frame traders, something I did not expect this morning. I don't think the market will find bids from longer time frame traders until it starts getting close to 1416-18 support. At those levels the drop from 1445 would about equal the length of the last two substantial reactions in this 6 month uptrend.
Once support in the 1416-18 zone is reached I expect the S&P's to start preparation for a move to 1455 and then to 1475.
1 comment:
Thank you Carl for posting the cash market value on SPX, I think I can track it ok here...
http://www.indexarb.com/?referrer=c1 Which gives the daily Fair Value Premium ... If that is correct you do not have to post for me, although, sure helpful for others.
Post a Comment