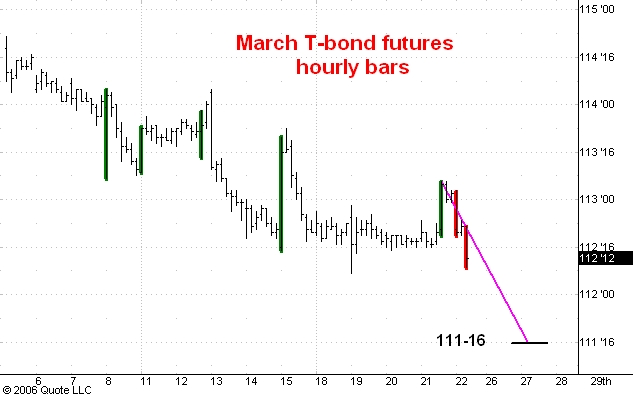
Here is an hourly chart of March T-bond futures. I last commented on this market here.
Today the market has put in two wide range down bars and this means it is headed for short term support near 111-16.
I have highlighted what I think is the most bearish feature of this chart. On five occasions over the past two weeks the market has put in a wide range up bar. These I have highlighted in green. In each case there was little or no follow through buying. This means that the sellers on these wide range up bars were predominantly longer time frame traders. This is especially bearish since these traders are "selling in the hole", i.e substantially below the 114-27 top of December 5. They evidently thing the bonds are going substatially lower from here. So do I. I think the market is headed down into the 109-110 range.
1 comment:
Happy Holidays
Thanks for this great site .
It's very informative and thought-provoking . You do wonderful work and it's well appreciated
Post a Comment