Here is an hourly chart showing pit trading in February gold futures. I last commented on this market here.
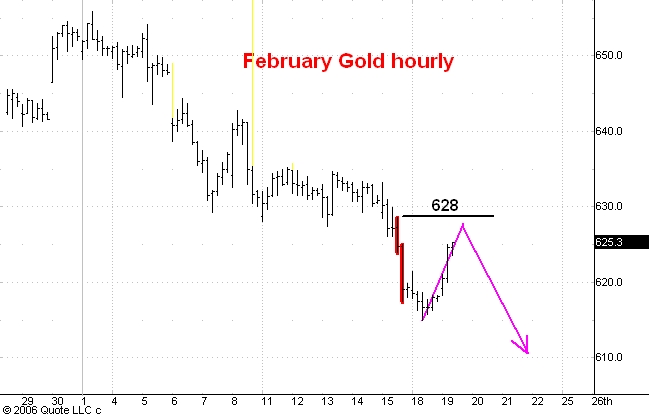
Notice the two consecutive down bars I have highlighted in red. These bars represent selling by longer time frame traders. The market only managed to drop another 2 dollars after the low of the second of these bars and this means that longer time frame buyers had entered the market.
When this happens the market has to rally to find more sellers. In this case I think we will see a rally about as big ($13) as the biggest rally on the way down from the 655 top. This would put the market close to the 628 level. Note that the high of the first red bar was also about 628. If longer time frame sellers took advantage of a price at 628 a few days ago it is reasonable to expect them to again sell if the market gets close to 628. So this is a second reason to expect resistance near 628.
The next step down should carry gold to 605. The market is still in the early stages of a drop which I expect to carry below the 500 level.
1 comment:
Dear Carl,
Perhaps you have explained this in a previous post that I missed - how do you decide whether particular buying or selling is by short-term, or long term players?
Also, is there a post where you describe why you expect gold to drop below 500? I went back through several old posts going back several months, but did not see the analysis.
Thanks!
Post a Comment