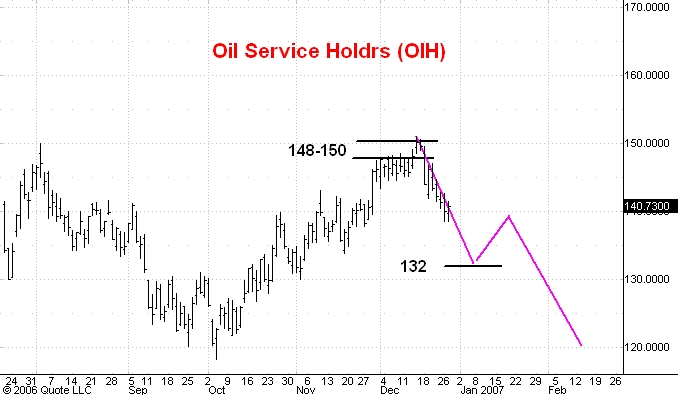
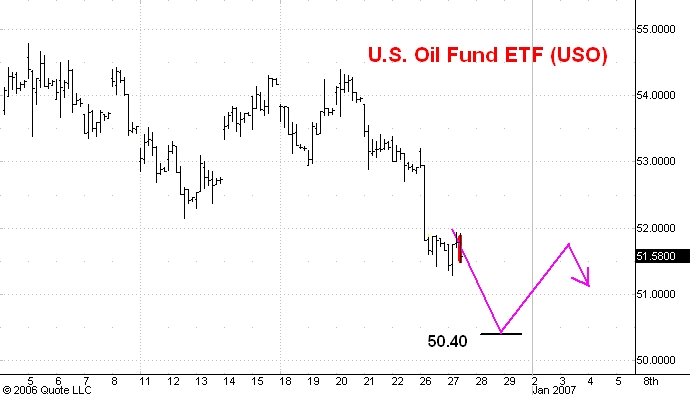
Here is an hourly chart of US OIL (USO), a crude oil ETF, and a daily chart of Oil Service Holdrs (OIH), an ETF of oil service stocks that is highly correlated with the price of crude oil. I last commented on OIH here.
I think the crude oil market is headed much lower over the next few months. The first support beneath the market for USO I see at 50.40. For OIH I see short term support in the 130-32 range. Both markets will probably rally to a lower top from support, but the rally will only be a brief interruption of a much bigger decline.
No comments:
Post a Comment