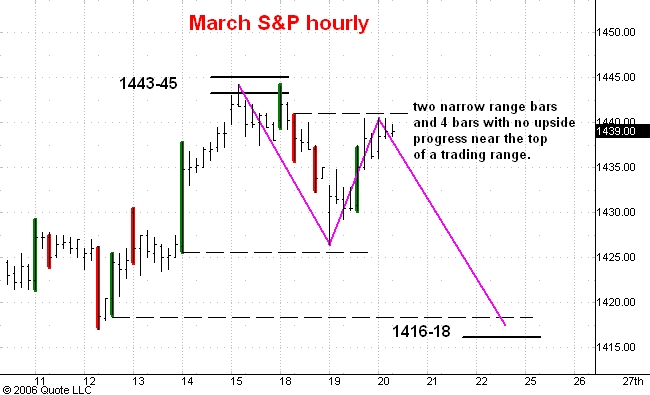
Here is an hourly chart of the March S&P e-mini futures which are now trading about 11 points above the cash index. I last commented on this market here.
The market has spent most of today trading above the 1438 level but below yesterday's late high at 1440.50. The S&P's are near the top of a 4 day trading range. The market has shown no follow through buying after two strong, wide range up bars yesterday afternoon. Over the past two hours the trading range has narrowed visibly.
Taken together these observations tell me that the market is going to head back down again. The strongest support is in the 1416-18 range. But there is now a good chance that the break will only carry down to 1431 or so and then be followed by a rally to new highs. I can't really tell which of these possiblities is the more likely one.
In any case I think the market is in a minor corrective phase and that in January we shall see a 1475 print.
No comments:
Post a Comment