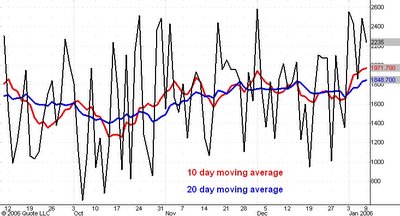
Here is a daily chart of the daily count of the number of issues on the New York Stock Exchange which advance in price (black line) as well as of the 10 day (red line) and 20 day (blue line) moving averages of this number.
Yesterday both the 10 day and 20 day moving averages reached their highest levels since the October 13, 2005 low at 1168 in the cash S&P 500. I have observed that if the market makes a new bull market high when the advancing issues 10 day moving average also makes a new high for the intermediate trend then the next significant top is at least one month and as much as two months away. If the same thing happens with the 20 day moving average, then the next important price top is two months to four months away.
So I conclude that the uptrend which began from the 1168 October 13 low will last at least until early March and quit possibly until early May. Note that I have used Lindsay's top-to-top counts to forecast highs for March 17 and April 5.
No comments:
Post a Comment