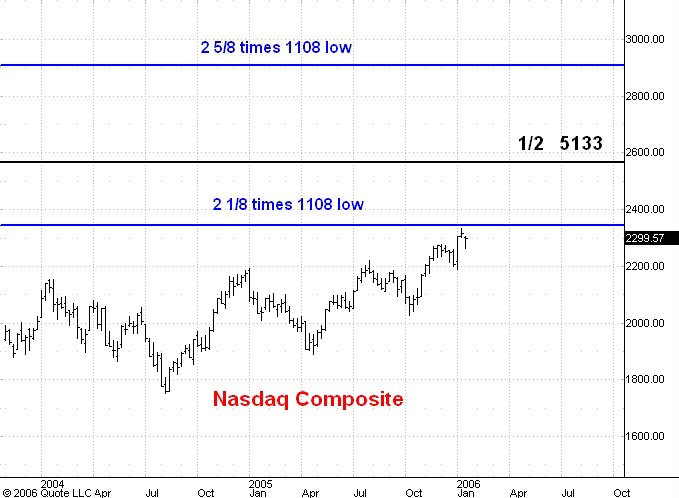
Here is a weekly chart of the Nasdaq Composite index.
The bear market low was 1108 in October 2002. I have drawn three important resistance levels on the chart. The black line sits at the 2566 level which is 1/2 the all time high for the index at 5133 in March of 2000. The blue lines are the 2 and 1/8 and the 2 and 5/8 multiples of the 2002 low at 1108. I think the bull market will end at the 2 and 5/8 multiple which is 2908.
No comments:
Post a Comment