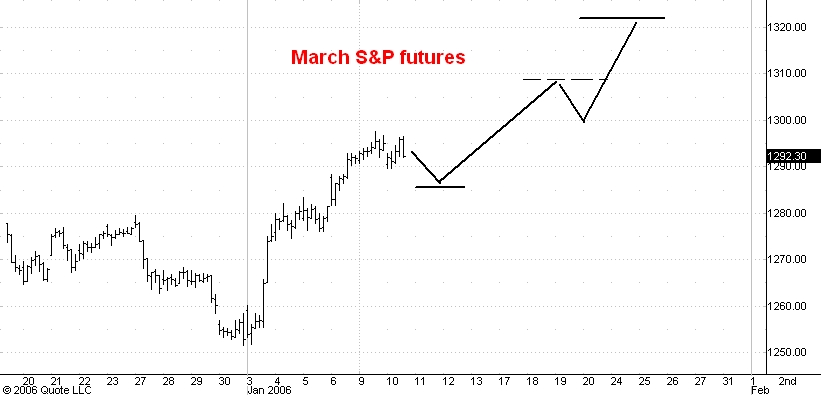
Here is an hourly chart showing pit trading in the March S&P futures.
I've drawn black lines to indicate support and resistance and the path I expect the market in terms of price levels (the time dimension is not something I pay much attention to over the short run).
Right now I think the market is reacting to support at 1285 and from there will rally to 1310, hesitate a little, and then continue up to 1322. From this last level I think a more substantial break will develop, but only one of 20 or 30 points.
No comments:
Post a Comment