
This morning the bond and note futures reached new highs for the rally which began from the November 4, 2005 low.
As you know I am bearish on both markets. I think the bonds are headed for 108 and the notes for 105. Above this post you will see two charts which support my contention that interest rates will be heading higher and bond prices lower from here.
These charts are available to subscribers of Decisionpoint.com. I think the $20 per month subscription price is well worth it for anyone interested in the technical analysis of the markets.
The first chart shows the yield on the 30 year treasury bond (actually a 26 year bond now). Remember that when bond prices go up interest rates go down and vice versa. So the rally in bond prices over the past 2 and 1/2 months shows up as a drop in yields on this chart.
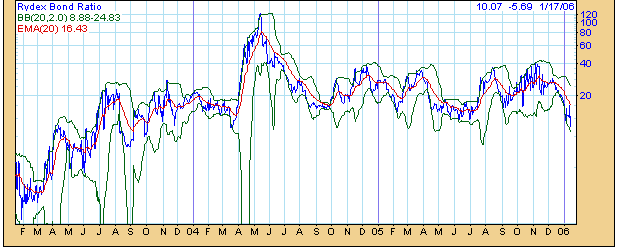
The second chart shows the Rydex bond ratio (blue line) and its 20 day exponential moving average (red line). The Rydex bond ratio records the level of assets held in one of the Rydex family of funds which bets on falling bond prices (rising interest rates) to the level of assets held in another Rydex fund which bets on rising bond prices. So low levels of the bond ratio reflects a general expectation that bond prices will rise while a high levels shows that traders expect bond prices to fall.
As you can see on the chart the Rydex bond ratio has recently dropped to its lowest level of the past two years. The 20 day exponential moving average is near a similar extreme.
This means that bond traders currently expect interest rates to fall and bond prices to rise from current levels. I think they will be disappointed. This is a situation in which it makes sense to "fade" the crowd.
No comments:
Post a Comment