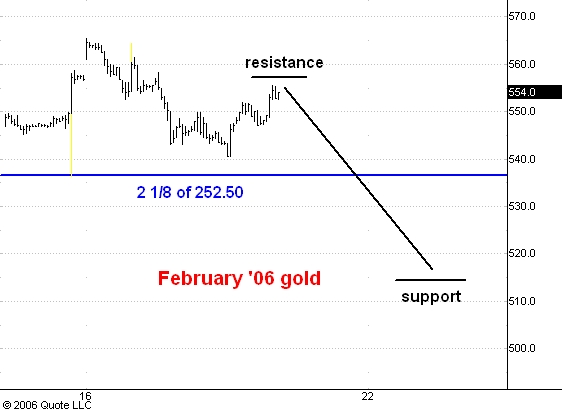
Here is an updated hourly chart showing pit and electronic trading in February gold futures.
I see resistance above the market at 557 and from there I am expecting a drop to 515 or so. The latter level is the bottom of the second 25 dollar box down from the 565 top.
No comments:
Post a Comment