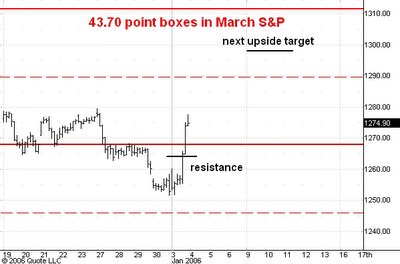

Earlier this afternoon I thought that the March S&P futures would halt today's rally at 1264 and then drop to my short term downside target near 1243.
As you can see from the updated hourly chart above, the market instead blew right through resistance at 1264. This means that it is headed for 1298 and ultimately for 1350.
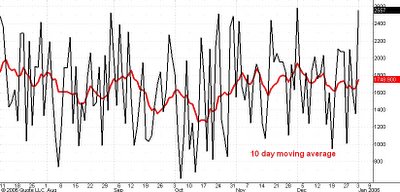
The second chart above this post shows the daily count (black line) of the number of issues traded on the New York Stock Exchange which advance in price. Today the market had an advancing issues count which was the second highest level seen in the last 18 months. This coupled with the two consecutive higher lows made by this indicator while the market made lower reaction lows is further evidence that a strong upswing has started.
No comments:
Post a Comment