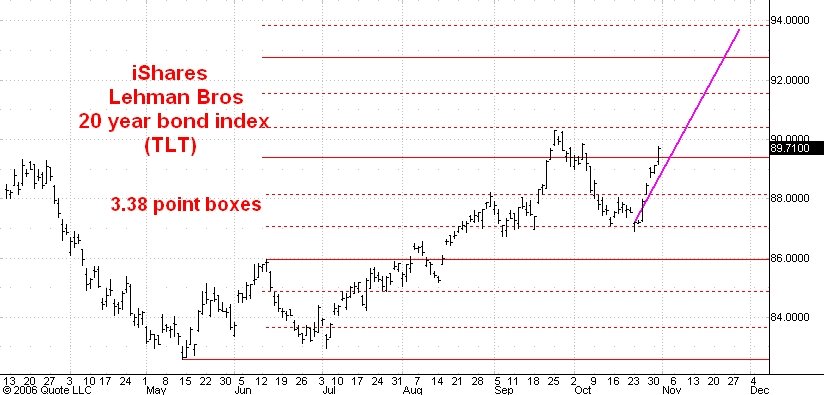
Here is a daily chart of an exchange traded fund, iShares Lehman Brothers 20 year treasury bond index (symbol TLT). This ETF is traded on the Amex.
One expects the price of this fund to track long term treasury bond prices pretty closely. You can see it made its low this year in May coincident witht the low in 30 year treasury bond prices and since has been rallying in what I believe to be a new bull market in bonds.
I have drawn boxes on the chart which ar 3.38 points high. TLT is a stock that seems to prefer bouncing between the 1/3 division points of its boxes and I have drawn these as dotted red lines. The tops and bottoms of boxes are shown as solid red lines.
I think TLT is now headed for the 93.80 level which is the 1/3 divion point of the next higher box.
No comments:
Post a Comment