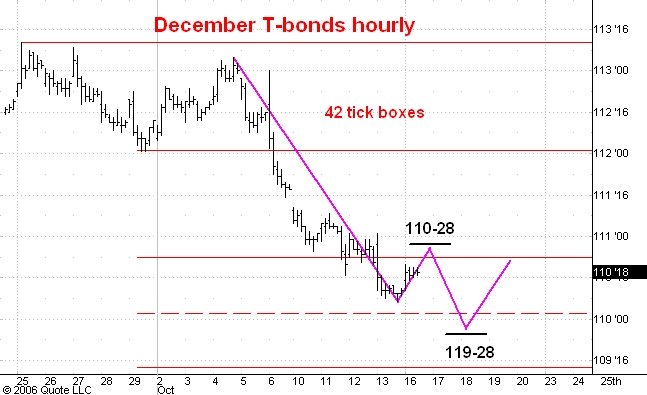
Here is an hourly chart of December T-bond futures. I last commented on this market here.
I think the market is in the process of developing support for a second phase rally within a three phase drop from 113-11 down into the 107-108 range. I think the market will rally up to 110-28 or so, then drop to 109-28 and then begin a bigger rally.
No comments:
Post a Comment