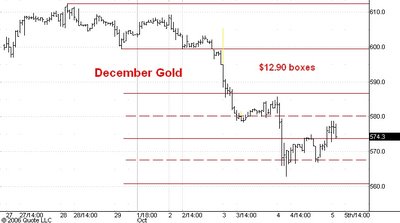
Here is an hourly chart showing pit and electronic trading in December gold futures. I last commented on this market here.
On this chart I have drawn short term trading boxes for the drop which started from 612.40 on Sepember 28. I have found that while in the middle of a trend the market is more likely to halt temporarily at the midpoint of a box rather than at its top or bottom. The subsequent reaction will usually be approximately as big as a previous reaction in the same trend and generally ends also at the top or bottom of a box or at a midpoint.
In the current situation I think the gold rally from yesterday's low at 563 is not likely to go higher than 580. In fact the current hourly bar shows a widening range in the down direction and this tells me that the rally is in fact probably over.
The bottom of the fifth box down is roughly at 548 which is also very close to the June 14 low in the expired August contract. I think the market's next rally will begin from approximately that level.
No comments:
Post a Comment