Thursday, November 30, 2006

Oil Service HOLDRS


Here is a daily chart of Oil Service HOLDRS. I last commented on this ETF here.

The market is within a point of the 148 upside target. I think crude oil has a good chance to rally further to 65.00 or so. In view of this I think OIH will probably move up a bit more than I originally thought, maybe to 150 or so. However, I believe that the nex 10 points in OIH will be downward. In fact I believe that a move to below 118 will begin soon.

S&P


Here is an hourly chart of the December S&P e-mini futures. I last commented on this market this morning.

It looks like the bear army has indeed run out of ammunition. Note that there was no follow through to the selling which produced the opening, wide range down bar today. In fact we now see an expanding range up bar showing the 12:30 - 1:30 trading. This tells me that the bulls are about to take control of this market and that a breakout above the last high at 1411.25 is imminent. The low of this bar at about the 1399 level should be support for the rest of the day.

Disaster Ahead ??


This week both Time Magazine and The Economist published cover stories which caught my attention. The first picture above this post is the Economist cover, the second is the May 27 Economist cover, and the top picture is the Time Magazine cover.

Take a look at the two Economist covers. The May 27 cover depicts a bear and the November 25 cover depicts a bull. At the time the May 27 cover was published I pointed out its bullish import. Now, 6 months later, I think the bull on the November cover is telling us that the rally from the June- July lows is nearly over. The next 100 point move from where the S&P trades now will probably be downward.

But in addtion to this I think both Time and The Economist are telling us something about the bigger picture, the longer term prospects for stock prices in the USA.

Note that even while the November 25 Economist cover depicts a bull, it is a bull hamstrung by ribbons of red tape. The cover headline (in the classic colors of fear - red and black) screams "Wall Street - What Went Wrong?"

The Time magazine cover is even more explicit. It depicts Mr. Everyman about to tumble into a chasm he fails to see. The headline asks "Why We Worry.....". The Time logo appears again in the classic colors of fear, red on black, with the "i" replaced by a bolt of lightening.

Neither this Time cover nor the Economist cover are covers I would expect to see near the start of a severe bear market. They show that public attitudes towards the stock market and towards life in general are fearful. From this I conclude that any drop in the averages we see during 2007 will be relatively mild, probably less than 20%. At the low I think we shall see as much or more bearish sentiment than was seen at the 2002 bear market lows. This in turn will set up an extremely strong bull market for 2008 and 2009.

Bear Army Counterattacks


Here is an hourly chart of the December S&P e-mini futures. I last commented on this market here.

Around 10 am Eastern Time today the bear army staged a counterattack which dropped the futures 10 points in less than 30 minutes. This shows as the last wide range down bar highlighted in red on the chart.

Note that the selling started at a higher level than did the selling during Monday's opening bar but it dropped the market about the same amount. I think the same people were responsible for both selling episodes. But I also think that the bull army will turn back this bearish counterattack. Why?

First, as I observed above, the selling started at a higher level than did Monday's early selling. This tells me that the bears are beginning to run out of ammunition. Second, note the two wide range up bars highlighted in green which developed during yesterday's opening hour and between 2:30 and 3:30 ET. Both bars show aggressive buying. The low of the first bar was 1392.25 and the low of the second was 1395.25. I think that the bears will not be able to push the market past the bullish defenses in the 1392-95 zone.

The next development will be a resumption of the rally to 1418-20.

Guesstimates on November 30, 8:50 am ET

December S&P Futures: The market is headed for 1418-20. Support today is at 1398.

March Bonds: Switching to the March ’07 contract trading even with December. I think that the bonds are headed for 115. Support stands at 113-08.

March 10 Year Notes: Switching to the March ’07 contract trading 2 ticks over December. The notes should rally to 110-16. Support stands at 108-20.

Euro-US Dollar: There is very strong resistance in the 131.50-132.00 zone. I think the next big move will be downward to 116 and below.

Dollar-Yen: I think the yen will find support near 115.00 and then resume its move to 121 and ultimately to 130.

January Crude: The market has rallied into the 62-63 range. I think it has a good shot at reaching 65.00 soon.

February Gold: Switching to the February contract trading 6 dollars over December. I am raising my upside target slightly to 662. From there I think an extended drop will start.

March Silver: Switching to the March contract trading 19 cents over December. Silver has broken well past my upside target so I think the market is now headed for 1450.

Google: Last January’s top at 475 is now support and I expect Google to resume its rally to 564.

Wednesday, November 29, 2006

New York Stock Exchange Group


Here is a daily chart of the New York Stock Exchange Group. I last commented on this stock here.

I think the bull market in NYX has further to go. I see support for this reaction at 92. The next upside target is 152 which is the 3 1/8 multiple of the June low at 48.62.

Another Battle


Here is an hourly chart of the December S&P e-mini futures. I last commented on this market here.

It looks to me like there is another battle going on between bull and bear armies in the S&P's.

Monday's wide range opening hour had its high at 1402.75 from which point an avalanche of selling from the bear army developed. The pace of this selling started to wane near the low of that opening bar at 1392.50.

This morning's opening bar had its low at 1392.25 and from this point the bull army began its advance, putting in a wide range up bar. The move continued just to the point where the bears took hold of the market on Monday; today's high so far is 1402.50!

This is not an uncommon occurrence in markets. In this case I think the bulls will hold their lines at 1392.00 and begin another attack that will take the market above 1403. If I am wrong and the market drops below 1391 then I shall conclude that the bears have the stronger forces and will carry the market back down below 1378.

CME


Here is a daily bar chart of the Chicago Merchantile Exchange. I last commented on CME here.

CME has actually managed to move past my long standing bull market target at 541. Still, I think the bloom is off this rose and that CME is more of a trading stock than an investment situation now.

I think the market will carry CME up to 595 or so this trip. The 599 level is the top of the second box defined by the hight of the recent trading range. Moroever, a rally to 595 would make the move up from the 485 low on October 23 equal in length to the move up from the August 29 low at 425 to the October 16 high at 535.

S&P


Here is an hourly chart of the December S&P e-mini futures. I last commented on this market here.

I thought that the S&P's would halt their rally near 1391 and then take out the 1378.75 low by a couple of points. But instead you can see today's first hour showing a wide range entirely above 1391 resistance. Just as significant is the fact that this bar is overlapping the wide range downside breakout bar that kicked off the drop to 1378.75 early Monday.

I conclude that 1378.75 was the reaction low and that the futures are now headed up to 1418-20 resistance.

Guesstimates on November 29, 8:50 am ET

December S&P Futures: The market is now trading above resistance at 1391 but I still think that the next development will be break down into the 1376-78 zone. Strength above 1394 would force me to abandon this view. In either case I expect to see the S&P’s trade into the 1418-20 zone by the end of the year.

December Bonds: I think that the bonds are headed for 115. Support stands at 113-08.

December 10 Year Notes: The notes should rally to 110-16. Support stands at 108-20.

Euro-US Dollar: There is very strong resistance in the 131.50-132.00 zone. I think the next big move will be downward to 116 and below.

Dollar-Yen: I think the yen will find support near 115.00 and then resume its move to 121 and ultimately to 130.

January Crude: The 58.00 level remains support and I think the market will rally into the 62-63 range soon.

December Gold: I still think the market will make it up to 650 before and extended drop begins.

December Silver: Traded as high as 1376 late yesterday but I think the next big move from here will be downward.

Google: Google traded 8 points below what I thought would be 485 support yesterday but closed above that level. Last January’s top at 475 is now support and I expect Google to resume its rally to 564.

Tuesday, November 28, 2006

Advancing Issues


Here is a line chart showing the daily count of the number of issues traded on the New York Stock Exchange that advance in price (black line) as well as the 5 day moving average of this number (purple line). I last commented on this indicator here.

At last week's top the 5 day moving average was higher than it had been in 10 weeks and this is one reason why I don't think that the market made an important top last week. I think we shall see this moving average drop this week to the light green horizontal line indicating a moderately oversold condition which typically ends 4-6 trading day reactions. On the day of the reaction low later this week I expect to see the daily count (black line) stay above the low it reached yesterday. Coupled with a moderately oversold condition in the 5 day moving average this will be a modest bullish divergence.

After this divergence develops I think we shall see the S&P futures rally to 1418-20.

S&P Update


Here is an hourly chart of the December S&P e-mini futures. I last commented on this market this morning.

I still think the S&P's will make it to 1391 or a bit higher before the market drops below 1380 again. The rally from this morning's low looks like it has completed two of three waves and the third and final wave upwards to 1391 appears to have started.

S&P


Here is an hourly chart of the December S&P e-mini futures. I last commented on this market here.

I wrote this morning's guesstimate just after the market hit it low so far today at 1378.75. I said that I expected the market to rally 10 to 15 points and then take a peek below 1378.75. So far the S&P's have rallied to 1389.75. I calculate resistance near 1391 and expect the market to drop 10-15 points from there into support at 1376-78.

I think this sequence of events will take most of the week. After the low is in I shall be looking for a move to 1418-20.

Guesstimates on November 28, 8:50 am ET

December S&P Futures: The market is trading in the 1378-79 support zone as I write this. I think it will rally 10 to 15 points from here and then come back down and take a peek below this low. This basing process should last the rest of the week. When it is complete I still expect the market to rally into the 1418-20 resistance zone.

December Bonds: I think that the bonds are headed for 115. Support stands at 113-08.

December 10 Year Notes: The notes should rally to 110-16. Support stands at 108-20.

Euro-US Dollar: There is very strong resistance in the 131.50-132.00 zone. I think the next big move will be downward to 116 and below.

Dollar-Yen
: I think the yen will find support near 115.00 and then resume its move to 121 and ultimately to 130.

January Crude: The 58.00 level remains support and I think the market will rally into the 62-63 range soon.

December Gold: I still think the market will make it up to 650 before and extended drop begins.

December Silver: I think we’ll see a 1360 print while gold rallies to 650 but in any case the next big move in silver will be downward.

Google: I expect Google to hold support around 485 and then resume its rally to 564.

Monday, November 27, 2006

S&P Update


Here is an hourly chart of the December S&P e-mini futures. I last commented on this market this morning.

The intial downward leg of the drop from last week's high of 1411.25 has been bigger than I expected. I now think the market will rally from its current low of 1384 and make it back up into the 1392-93 zone. From there a third phase drop will probably carry the S&P's down a little more than I initially thought, probably into the 1378-79 range. This would involve a quick peek below the November 10 low at 1379.25.

Domed House Update


Here is a daily bar chart showing the current position of the Dow industrials within an example of a minor three peaks and a domed house pattern (red numerals). I last discussed this pattern here.

The market has put in a top as projected for late November. The issue now is whether or not it is the peak of the domed house as depicted above or whether it is just point 17 as illustrated in the schematic shown in my last post on this subject.

Right now I am leaning towards the point 17 interpretation instead of the labeling you see above as point 23. I have three reasons.

First, this very fast break only the second day off of the top is characteristic of a bull market reaction, not the start of a downleg in a bear market. Secondly, I note that neither the 5 nor the 10 day moving averages of the daily count of the number of issues advancing showed any substantial bearish divergence at last week's high. Finally, I still think that short term market timers are prepared to turn bearish at the drop of a hat instead of buying reactions.

All these factors make me think that this break will only last 4-6 trading days and end above point 22. If this happens I will relabel the recent high point as red point 17, the subsequent low point 18 and expect the domed house (points 21-23-25 ) to form during the first quarter of 2007.

If the market instead takes out red point 22 on the chart above I will have to accept the recent high as point 23 and start looking for a substantial drop during the first half of 2007.

S&P


Here is an hourly chart of the December S&P e-mini futures. I last commented on this market here.

In this morning's guesstimate I said that the market was headed down into the 1396-98 support zone. But instead of stopping there as I had expected the S&P's continued lower to 1392.50 (so far). Not only was support broken by a visible amount, but it was broken while the market was putting in a wide range down bar.

This behavior tells me that a 30 point break has begun. A correction this big would equal the length of the last signficant drop from the October 26 top at 1395.25 to the November 3 low at 1365.50.

Meantime I think the market will rally about as much as it did from Friday's electronic low at 1400, i.e. about 8 points. This would bring the S&P's up to 1400 or so, below resistance which I think stands in the 1400-01 zone. After this rally the third phase of the correction should carry the market down to 1381.

I still think we shall see a rally at least to the 1418-20 resistance zone by the end of the year.

Mr. Lindsay Meets Mr. Elliott

For a very long term forecast of US stock prices take a look at this post.

Guesstimates on November 27, 8:50 am ET

December S&P Futures: The market is headed for support in the 1396-98 range. The next development will then be a move up into the 1418-20 resistance zone.

December Bonds: I think that the bonds are headed for 115. Support stands at 112-24.

December 10 Year Notes: The notes should rally to 110-16. Support stands at 108-00.

Euro-US Dollar
: There is very strong resistance in the 131.50-132.00 zone. I think the next big move will be downward to 116 and below.

Dollar-Yen: I think the yen will find support near 115.00 and then resume its move to 121 and ultimately to 130.

January Crude: The 58.00 level remains support and I think the market will rally into the 62-63 range soon.

December Gold: I still think the market will make it up to 650 before and extended drop begins.

December Silver: I think we’ll see a 1360 print while gold rallies to 650 but in any case the next big move in silver will be downward.

Google: I think the rally will continue up to its 564 target. Support is at 485.

Sunday, November 26, 2006

Grand Supercycle Fifth Wave Extension

Mr. Lindsay Meets Mr. Elliott - a VERY Long Term Look Ahead for Stocks

As you know I am a big believer in the methods George Lindsay used to predict the stock market. You can read all my George Lindsay posts here.

But the stock market was only one of George Lindsay's interests. He also devoted a great deal of effort developing what he called the "technical analysis of history". This involved connecting apparently disparate events in the economic, political and cultural life of a nation via certain fixed periods of time. Lindsay wrote a book about some of his methods entitled "The Other History" which unfortunately is now out of print.

One of Lindsay's theories is that every nation goes through repeating periods of approximately 400 years in length. During the first 300 years or so the nation's political, military, and economic strength increases on average, but during the last 100 years or so the nation goes through a period of decline.

I like to date the emergence of the United States as a national concept from 1770, about 4 years prior to the start of the Revolutionary war. Lindsay perferred the date of 1791. According to Lindsay's theory one would then expect the political, military, and economic power of the United States to increase on average until 2070 or 2091. It is not a great leap of faith to then expect that US stock prices would also moving upward on average during this same period of time.

I think this prediction derived from Lindsay's technical theory of history should be of interest to Elliott wave afficianados. As far as I can determine most Elliott theorists believe that an upwave of Grand Supercycle degree began in USA stock prices in the late 1700's. Robert Prechter dates the beginning of this Grand Supercycle degree wave from 1784.

As is well known Prechter had been expecting the top of the Grand Supercycle upwave to develop at various times; the earliest such predicted top was 1987 . It is my understanding that, at least until recently, he believed that the Grand Supercycle top had actually occurred in 2000.


I believe that this expectation of an imminent Grand Supercycle top is not consistent with Lindsay's theory of the 300 year expansion period which for the United States should continue at least until the year 2070 and possibly until 2091 or even later. But what I find interesting is that there is a simple ALTERNATIVE Elliott expectation which is consistent with both Lindsay's and with Elliott's theory.
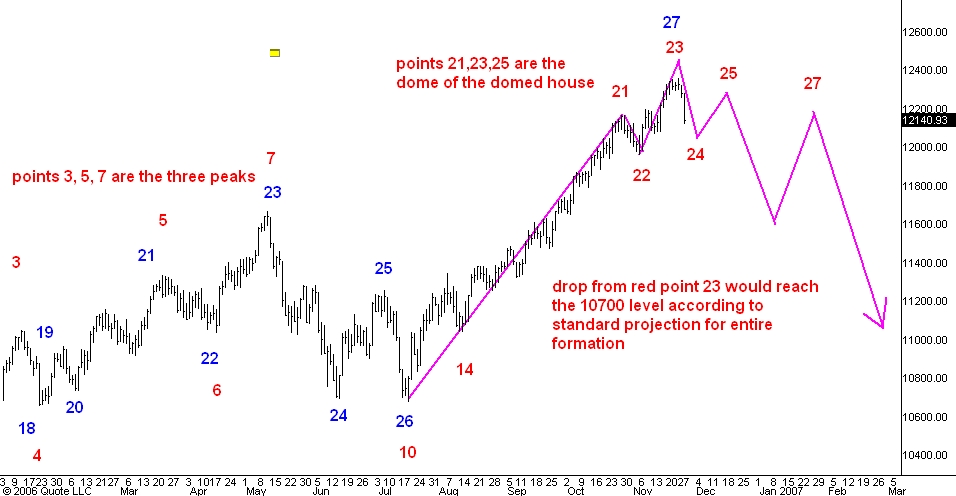
This alternative expectation is illustrated above this post. It calls for the fifth and final wave of the Grand Supercycle upwave from 1784 to be an extended wave of Supercycle degree. If the Grand Supercycle has an extended upwave as its fifth wave the whole move upward from 1784 will probably look like a 9 wave sequence (5 up and 4 down) instead of the standard 5 waves (3 up and 2 down). Put another way, one would expect to see within the Grand Supercycle four really big corrective waves. So far we have seen three: 1835 t0 1857, 1929 to 1932, and 2000 to 2002. The fourth would probably develop sometime during the second third of this century.

Here is some evidence which relies on "repeating time intervals" to support this prediction.

The 1835 top developed 51 years after the start of the Grand Supercycle. The 1929 top developed 72 years after the supercycle low in 1857. The 2000 top developed 68 years after the supercycle low in 1932. The median number is 68 years and adding this to the 2002 low then predicts a top for 2070.

Here is some Fibonacci evidence. Adding 144 years to 1784 give 1928, the date of the "orthodox" Elliott wave top in 1928. Adding 144 years to the 1857 supercycle low give 2001, one year after the 2000 top. And adding 144 years to the 1932 supercycle low gives 2076 as the year of an important top.

So I think that Mr. Lindsay and Mr. Elliott might agree on the following prediction. The US stock market is nowhere near the top of the current grand supercycle wave which began in 1784. Instead US stock prices are in the early stages of a 68-72 year upmove which will take the averages to levels making today's prices look very, very low by comparison.

Friday, November 24, 2006

Don't Look Back, Something Might Be Gaining On You !!!

As you know this blog is relentlessly forward looking. I make it a policy never to discuss my past forecasting successes and failures. If you are interested in these you can follow the links in my posts or the links on the right hand side of this blog.

This is part of my program of giving you forecasts of the future, not forecasts of the past. I try to follow Satchel Paige's advice : "Dont' look back, something might be gaining on you".

Of course traders can't resist the temptation to look back every once in awhile, if only to prepare the P&L for tax season. And this raises the question of what a person can learn from his or her own trading history.

My own view is that traders pay far too much attention to their losses. I think that losses are best forgotten. Instead, a trader should strive to remember his or her profits.

Be on the lookout for a repeat of the circumstances that cradled the profitable entries and exits on you P&L. It is these successes that you should strive to emulate. What did you see that led you to put on a profitable trade? How did the market behave while you were in it? Why and how did you take your profits? Answer these questions and then start looking for similar opportunites tomorrow.

Guesstimates on November 24, 9:15 am ET

December S&P Futures: The market broke early this morning on dollar weakness, but I think it will hold support which still stands at 1398. The next development will be a move up into the 1418-20 resistance zone.

December Bonds: I think that the bonds are headed for 115.

December 10 Year Notes: The notes should rally to 110-16.

Euro-US Dollar: The euro has taken out its June high at 129.76, rising as high as131.09 this morning on breakout buying and short covering. Since the 131-132 zone is my upside target I think that the next big move from this area will be downward to 116 and below.

Dollar-Yen: I think the yen will find support near 115.00 and then resume its move to 121 and ultimately to 130.

January Crude: The 58.00 level is still support today and I think the market will rally into the 62-63 range soon.

December Gold: Gold traded as high as 639 this morning and I still think the market will make it up to 650 before and extended drop begins.

December Silver: Silver reached the 1350 target this morning. I think we’ll see a 1360 print while gold rallies to 650 but in any case the next big move in silver will be downward.

Google: I think the rally will continue up to its 564 target. Support is at 485.

Thursday, November 23, 2006

The Game in Wall Street

I generally don’t recommend books on speculation to people. Most that I have read are either worthless or misleading. And in any case it is one of my most strongly held beliefs that 99% of the people interested in speculation SHOULD NOT SPECULATE.

Having said this I want to tell you about an 80 page paperback I have just read. It is entitled “The Game in Wall Street, and How to Play It Successfully”. Its anonymous author calls himself “Hoyle”. It was written in 1898, more than 100 years ago.

There is more truth and straight talk about markets in this little book than I have encountered in any book I can recall reading. “Hoyle” explains that the markets will separate you from your money if you play the game like an amateur. He emphasizes repeatedly that the professional trader looks for his buying opportunities when prices are relatively low and his selling opportunities when prices are relatively high. He also emphasizes the importance of trying to trade in harmony with the direction of the “bull campaigns” and the “bear campaigns” which typically last several months. Each year usually sees at least one of each.

I especially like “Hoyle’s” Hint Fourteen. He says, “One must take broad views and look ahead, in order to succeed in Wall Street. There everything is anticipated. If bad news is expected, do not sell after the worst is known, but buy. …..Anticipate! Anticipate!! Anticipate!!!”

Wednesday, November 22, 2006

Guesstimates on November 22, 8:50 am ET

December S&P Futures: I think the market is on its way to 1418-20 resistance. Meantime support remains at 1398. After 1418-20 is reached I expect the S&P’s to drop 30 points or so.

December Bonds: I think that the bonds are headed for 115.

December 10 Year Notes: The notes should rally to 110-16.

Euro-US Dollar: I think that the market will take out its June 5 high at 129.76 before the advance from 124.83 is complete.

Dollar-Yen: The yen is approaching the 116.00 support level. But this downside action is a breakout from a three week congestion zone so I now think the market will drop to 115.00 or so before a move to 121.00 begins. I expect to see the yen at 130 next year.

January Crude: The 58.00 level is again support today and I think the market will rally into the 62-63 range soon.

December Gold: I still think the market will move up to 650 before an extended drop begins.

December Silver: Silver should rally to 1350 before a substantial drop begins.

Google: GOOG has reached its initial 507 target. I think the rally will continue up to its higher 564 target. Support is at 485.

Tuesday, November 21, 2006

T-bonds


Here is an hourly chart of December T-bond futures. I last commented on this chart here.

As you can see the market is in the process of putting in a wide range up bar which breaks above the recent two day trading range. I think this means that the low of November 16 at 112-03 will hold and that the bonds are headed for the 115-01 level which is the 1/2 point of the next higher box.

Baidu


Here is a daily chart of Baidu.com. I last commented on BIDU here.

BIDU is approaching the 120 target. But since I think that Google has more to go on the upside, I am beginning to think that BIDU can reach the higher target of 139, near the 3 and 1/8 multiple of its February low at 44.44.

Google


Here is a daily chart of Google. I last commented on GOOG here.

Google has reached the intial Fibonacci target at 507. I think it will hesitate here briefly, but I also believe that in a few weeks GOOG will be trading at the higher Fibonacci target of 564.

S&P


Here is an hourly chart of the S&P e-mini futures. I last commented on this market yesterday afternoon.

In that last post I noted the wide range down bar which told me that the market was again headed down into the 1396-98 support zone. But that dog didn't bark! By this I mean that, instead of continuing its break on subsequent bars as would be normal behavior, the market has rallied for almost three trading hours and has retraced most of that wide range down bar.

I think this means that the S&P's are now headed up into the 1418-20 resistance zone and that the low of yesterday afternoon's break at 1401.25 will hold in the meantime.

Guesstimates on November 21, 8:50 am ET

December S&P Futures: I still think the market will drop into the 1396-98 support zone before resuming its rally to 1418-20. In any case, after 1418-20 is reached I expect the S&P’s to drop 30 points or so.

December Bonds: Resistance is at 113-12. I still think that the bonds are headed back down to the low of the current trading range near 111-16. After that the market should rally to 115.

December 10 Year Notes: The notes are headed down to 107-12 or so from which point they should rally to 110-16.

Euro-US Dollar: Support still stands at 127.40. I also think that the market will take out its June 5 high at 129.76 before the advance from 124.83 is complete.

Dollar-Yen: A rally past 118.60 will turn me short term bullish again. Meantime I shall stick with my view that the yen should drop to 116.00 or so and then rally to 121.00. I expect to see the yen at 130 next year.

January Crude
: The 58.00 level is againl support today and I think the market will rally into the 62-63 range soon.

December Gold: Support in gold is now at 613. I still think the market will move up to 650 before an extended drop begins.

December Silver: Silver held support near 1255 and now should rally to 1350 before a substantial drop begins.

Google: GOOG will soon reach its initial 507 target and then move on to its higher 564 target. Support is at 463.

Monday, November 20, 2006

S&P


Here is an hourly chart of the December S&P e-mini futures. I last commented on this market here.

The market rallied back to 1408 this morning but now has put in a wide range down bar. I think this means that the market is headed back down into the 1396-98 support range.

I still think that the market will soon rally to 1418-20 resistance.

Guesstimates on November 20, 8:50 am ET

December S&P Futures: Support today is at 1398. The market is on its way into the 1418-20 zone. After that I shall be expecting another break of 30 points or so.

December Bonds: Resistance is at 113-12. I still think that the bonds are headed back down to the low of the current trading range near 111-16. After that the market should rally to 115.

December 10 Year Notes: The notes are headed down to 107-12 or so from which point they should rally to 110-16.

Euro-US Dollar: Support stands at 127.40. I also think that the market will take out its June 5 high at 129.76 before the advance from 124.83 is complete.

Dollar-Yen
: A rally past 118.60 will turn me short term bullish again. Meantime I shall stick with my view that the yen should drop to 116.00 or so and then rally to 121.00. I expect to see the yen at 130 next year.

January Crude: The 58.00 level is still support today and I think the market will rally into the 62-63 range soon.

December Gold: Support in gold is now at 613. I still think the market will move up to 650 before an extended drop begins.

December Silver
: Silver held support near 1255 and now should rally to 1350 before a substantial drop begins.

Google: GOOG will soon reach its initial 507 target and then move on to its higher 564 target. Support is at 463.

Friday, November 17, 2006

S&P Update


Here is an hourly chart of the December S&P e-mini futures. I commented on this market earlier today.

I no longer believe that the market will take a peek below 1398 before turning upward. It now looks like the early low at 1398 ended the correction from 1408 and that the market is headed for resistance in the 1418-20 zone.

Gold and Silver


Here are hourly chart showing pit trading in December gold and December silver futures. I last commented on gold here and on silver here.

Gold held above 613 support and silver above 1255 support and I think both markets are now headed upward. I think gold will rally to 650 and silver to 1350.

S&P


Here is an hourly chart of the December S&P e-mini futures. I last commented on this market here.

As you can see the S&P's have quickly dropped to 1398 support from yesterday's late high at 1408 (which was in fact a double top against a pre-opening high of 1408 also). I think the market will take a peek below 1398 before the reaction ends, perhaps dropping as low as 1396, the low reached after the breakout above the 1395.25 high.

The next significant development should be a rally into resistance which I now project will be found in the 1418-20 range.

Oil Service HOLDRS


Here is a daily bar chart of Oil Service HOLDRS. I last commented on this ETF here.

I think the market is completing the third and last phase of a three phase decline from 143. At the133 level the drop would equal the size of the previous reaction from 139 to 129. So I think 133 is support and that the next development will be a rally to 148.

T-bonds


Here is an hourly chart of December T-bond futures. I last commented on this market here.

I have shown the current resistance zone on the chart. It ranges from 112-21, the level of the daytime low on Wednesday, to 112-16, the point at which a rally from 112-03 would equal the 23 tick rally that ended at yesterday's high.

I think the bonds are headed down to the low of the current trading range and the 1/2 point of the current box near 111-16.

Guesstimates on November 17, 8:50 am ET

December S&P Futures: Support today is near 1398. From there the market should rally into the 1410-12 zone and possibly all the way to 1420. After that rally I shall be expecting another break of 30 points or so.

December Bonds: The bonds are headed back down to the low of the current trading range near 111-16. After that the market should rally to 115.

December 10 Year Notes: The notes are headed down to 107-12 or so from which point they should rally to 110-16.

Euro-US Dollar: Support now stands at 127.40. I also think that the market will take out its June 5 high at 129.76 before the advance from 124.83 is complete.

Dollar-Yen: A rally past 118.60 will turn me short term bullish again. Meantime I shall stick with my view that the yen should drop to 116.00 or so and then rally to 121.00. I expect to see the yen at 130 next year.

January Crude
: The 58.00 level is still support today and I think the market will rally into the 62-63 range soon.

December Gold
: Support in gold is now at 613. I still think the market will move up to 650 before an extended drop begins.

December Silver: Silver should hold support near 1255 and then rally to 1350 before a substantial drop begins.

Google
: GOOG will soon reach its initial 507 target and then move on to its higher 564 target. Support is at 463.

Thursday, November 16, 2006

Crude Oil Update


Here is an hourly chart of January crude oil futures. I commented on this market earlier today.

As you can see crude oil has broken below what I thought would be support at 59.20 on wide range bar so I now think it will reach 58.00 before a good rally can begin.

Gold


Here is an hourly chart of December gold futures. I last commented on this market here.

Gold has put in a wide range down bar and this tells me it is heading down to support at 619. If the market goes lower than this it still should halt above stronger support at 613. I still think gold has a good chance of making it up to 650 before an extended drop begins.

Silver Update


Here is an hourly chart of December silver futures. I commented on this market a little while ago.

As you can see silver is putting in a wide range breakout bar below support at 1305. This tells me that the market is headed back down to the low of the recent trading range. Support for this move is 1255.

Crude Oil


Here is an hourly bar chart of pit trading in January '07 crude oil futures. I last commented on this market here.

I am switching to the January contract today; it has been trading about 2 dollars over December.

The market is putting in a wide range downside breakout bar as you can see on the chart and this means that it is headed for the 59.20 level. I still think crude oil will rally substantially from the low end of the 4 dollar trading range which has confined it for the past 6 weeks.

T-bond Update


Here is an updated hourly bar chart of the December T-bond futures. I commented on this market just a short while ago.

As you can see the market is in the process of putting in a wide range downside breakout bar below 112-20 support. I think this means that the market is now headed for 111-16.

However, I still think that the bonds will trade at 115 before they trade at 110.

Silver


Here is a 15 minute bar chart of December silver futures. I last commented on silver here.

Silver has reacted to support near today's pit open and just a tad underneath the 1305 high I have shown on the chart. I think the move up to 1350 is about to resume.

T-bonds


Here is an hourly chart of December T-bond futures. I last commented on this market here.

After a fast rally this morning on the CPI number the market has dropped back into its support zone. I think it is going up from here. Next upside resistance is near 113-30.

S&P


Here is an hourly chart of the December S&P e-mini futures. I last commented on this market here.

I see support at 1398 or a bit higher. That was the level of the high on Sunday night, October 22, in electronic trading. It also would mark a drop of 10 points from the high this morning at 1408; such a drop would equal the length of the last reaction from 1392.75 to 1383.

I see resistance above the market in the 1410-12 zone. And I believe that the market will first trade in the 1398-1400 zone and then rally to 1410-12.

Guesstimates on November 16, 8:50 am ET

December S&P Futures: This morning’s CPI news has sent the market to 1408 so far. Today support will be in the 1398-1400 range. The S&P’s are about to enter the 1410-20 range from which another break of at least 30 points is likely.

December Bonds: The bonds have held the 112-24 support level and now are on the way up to 113-30. The market should reach 115-01 in a few weeks.

December 10 Year Notes: The notes are headed up to 109-16. Support is at 108-04.

Euro-US Dollar: The euro should find support near 127.70. I also think that the market will take out its June 5 high at 129.76 before the advance from 124.83 is complete.

Dollar-Yen: The yen should drop to 116.00 or so and then rally to 121.00. I expect to see the yen at 130 next year.

December Crude: The 58.50 level is still support today and I still think the market will rally to 62.00 or so.

December Gold: Support in gold is at 613. I still think the market will move up to 650 before an extended drop begins.

December Silver: Silver should reach 1350 before and substantial drop begins. Support is at 1255.

Google: GOOG will soon reach its initial 507 target and then move on to its higher 564 target. Support is at 463.

Wednesday, November 15, 2006

Coming to a Boil ?


Here is an hourly chart of the December S&P e-mini futures. I commented on this market earlier today.

Not much has changed since that last post, although the market has finally entered the 1402-04 range which I think will produce a temporary stall.

But what really catches my attention here is the slow activity evidenced by the narrow hourly trading ranges. This tells me that there is still a lot of skepticism about the market even as it breaks out to new highs for the bull market which started from 768 in October 2002.

I don't believe we will see any important top until the hourly trading ranges grow visibly bigger and the sizes of daily fluctuations start attracting some media comment. I think the pot must first come to a boil before this bull market is cooked!

Oil Service HOLDRS


Here is a daily bar chart of the Oil Service HOLDRS Exchange Traded Fund. I last commented on OIH here.

I had thought that the market ended its rally at the last high of 143.19 on November 9. But the reaction from that level lasted only two days and the market now is trading back above the 140 level. I think this means that OIH will extend its rally upward to 148.

T-bonds


Here is an hourly chart of December T-bond futures. I last commented on this market here.

I think the market is being supported in the zone between a previous high at 112-20 and 112-28 which is the level at which the current break from 113-19 will equal the size of the last reaction from 113-05 to 112-14. The midpoint between these two levels is 112-24 and so far that is where the market has halted.

I think the next swing will carry up to 113-30.

S&P


Here is an hourly chart of the December S&P e-mini futures. I last commented on this market here.

So far today the S&P's have reached 1401.50, just shy of the 1402-04 resistance zone. I think the market will be supported in the area between yesterday's early day session high at 1392.75 and the October 26 high at 1395.25. I still think that the market will reach the 1410-20 zone by the end of the month.

Guesstimates on November 15, 8:50 am ET

December S&P Futures: Support today is in the 1390-92 range. This upswing should soon carry the market into the 1402-04 range and be followed by a break of 10 points or so. By the end of the month I expect the S&P’s to have traded in the 1410-20 zone.

December Bonds: The bonds have broken below my initial estimate of support at 113-02 but should hold the 112-24 level. I think this market is headed up to the 115-01 or so.

December 10 Year Notes: The notes are headed up to 109-16. Support is at 108-04.

Euro-US Dollar: The euro should find support near 127.70. I also think that the market will take out its June 5 high at 129.76 before the advance from 124.83 is complete.

Dollar-Yen: The yen should drop to 116.00 or so and then rally to 121.00. I expect to see the yen at 130 next year.

December Crude: The 58.50 level is still support today and I still think the market will rally to 62.00 or so.

December Gold: Support in gold is at 613. I still think the market will move up to 650 before an extended drop begins.

December Silver: Silver should reach 1350 before and substantial drop begins. Support is at 1255.

Google: GOOG will soon reach its initial 507 target and then move on to its higher 564 target. Support is at 463.

Tuesday, November 14, 2006

S&P - Bears Defeated


Here is an hourly chart of the December S&P e-mini futures. I last commented on this market a short while ago.

As you can see the market is showing a wide range breakout above today's pit high and the October 26 high at 1395.25. In doing so the S&P's have moved well past the levels at which aggressive selling has entered the market during the past week (red bars). I think this means that the bears have run out of ammunition and that the market is headed substantially higher.

I estimate support now stands at 1392 and that the market will continue up into the 1402-04 range before it hesitates substantially. I still expect to see the 1410-20 range by the end of the month.

S&P - The Battle Continues.


Here is an hourly chart of the December S&P e-mini futures. I last commented on this market here.

The market has so far rallied to 1389.75, almost two points above yesterday's close and almost a point above the 1/2 retracement of the drop from the early electronic high (not shown on the chart) at 1395 to this morning' 1383 low. The market has also traded almost three points above resistance at 1387.

This behavior shows a level of strength that is not consistent with my expectation of a move to to 1375. Morover, note that the last hourly bar, highlighted in green, shows an expanded range and has its low at the level at which the three previous bullish surges started.

I conclude that this morning's drop was a completed correction and that the market is now headed up into the 1402-04 range. The low of the last green bar at 1384.50 will now be support.

T-bonds


Here is an hourly chart of December T-bond futures. I last commented on this market here.

I expect the bonds to be supported at 113-02. This is a tad below the level of the last top and would make the reaction from today's high at 113-19 equal to the reaction of November 7 - 8.

I still think the market will make it to the 1/2 point of the current box at 115-01 before a substantial reaction begins.

S&P Update


Here is a quick update to my last post.

The market has dropped to 1383 and is now rallying. A 4 point rally would carry to 1387 which is the low of yesterday's afternoon reaction. That level is where I now see resistance. From there I think the market will resume its drop to 1375.

S&P


Here is an hourly chart of the December S&P e-mini futures. I last commented on this market here.

Today's opening hour is shaping up as a wide-range "outside" bar and shows that the bears are agressively selling this market. Support in the 1387-88 range has been broken. I conclude that the market is headed down to 1375 or so. However, after this opening selling I think the market will rally 4 points or so before it resumes its drop to 1375.

Guesstimates on November 14, 8:50 am ET

December S&P Futures: Support today is in the 1387-88 range. Next upswing should stop temporarily in the 1402-04 zone. By the end of the month I expect the S&P’s to have traded in the 1410-20 zone.

December Bonds: The bonds are headed up into the 115-01 or so. Support is at 112-24.

December 10 Year Notes: The notes are headed up to 109-16. Support is at 108-04.

Euro-US Dollar: The euro should find support near 127.70. I also think that the market will take out its June 5 high at 129.76 before the advance from 124.83 is complete.

Dollar-Yen: The yen should drop to 116.00 or so and then rally to 121.00. I expect to see the yen at 130 next year.

December Crude: The 58.50 level is still support today and I still think the market will rally to 62.00 or so.

December Gold: Gold is headed for 650 and quite possibly up into the 675-80 range. Support today is at 620.

December Silver: Silver should reach 1350 before and substantial drop begins. Support is at 1270.

Google
: GOOG will soon reach its initial 507 target and then move on to its higher 564 target. Support is at 463.

Monday, November 13, 2006

S&P Update


Here is an hourly chart of the December S&P e-mini futures. I last commented on this market this morning.

So far the market has been supported near the 1388 level. On this chart I have illustrated the battle between the bulls and the bears that has been fought during the past week.

The three wide range bars highlighted in red show the bears' aggressive selling. Note how they begin and end at just about the same price in each case. This tells me that the same people have been involved in each of these three selling episodes.

The three wide range bars highlighted in green show the bulls' aggressive buying. Again note how they begin and end at roughly the same price in each case. This means that the same people have been involved in each of these three selling episodes.

But note that the market is now in its fourth hour after this morning's high. At each of the two previous tops on the chart the market had broken substantially by this time. But today it is holding 1388 support. This makes me think that the bears have run out of ammunition and that the market is about to break out above the 1395.75 level.

T-bonds


Here is an hourly chart of December T-bond futures. I last commented on this market here.

I think the reaction from Friday's high of 113-05 is about over. It has reached support near a previous high on the way up and at the point where it is equal in length to the last reaction.

The next development should be a breakout above the September 25 top at 113-11.

S&P


Here is an hourly chart of the December S&P e-mini futures. I last commented on this market here.

The advance into the 1410-20 range is still in progress. As you can see the market has rallied sharply from Friday's low at 1379.25 and has put in a wide range up bar as today's opening hour. I expect the S&P's to hesitate below the 1395.75 top of October 26 but today I also think that support near 1388 will hold.

After the market breaks above 1395.75 I think it will quickly reach the 1402-05 range before a brief reaction sets in.

Three Peaks and a Domed House

On Saturday I posted my latest update on the developing Three Peaks and a Domed House formation in the Dow Industrials. You can find that post here.

Guesstimates on November 13, 8:50 am ET

December S&P Futures: Support remains in the 1378-81 range today. The next important move will be upward into the 1410-20-zone.

December Bonds: The bonds are headed up into the 115-01 or so. Support is at 112-22.

December 10 Year Notes: The notes are headed up to 109-16. Support is at 108-04.

Euro-US Dollar: The euro should find support near 127.70. I also think that the market will take out its June 5 high at 129.76 before the advance from 124.83 is complete.

Dollar-Yen: The yen should drop to 116.00 or so and then rally to 121.00. I expect to see the yen at 130 next year.

December Crude: The 58.50 level is support today and I still think the market will rally to 62.00 or so.

December Gold: Gold is headed for 650 and quite possibly up into the 675-80 range. Support today is at 620.

December Silver
: Silver should reach 1350 before and substantial drop begins. Support is at 1270.

Google
: GOOG will soon reach its initial 507 target and then move on to its higher 564 target. Support is at 463.

Saturday, November 11, 2006

Three Peaks and a Domed House


I have been following the development of two concurrent examples of George Linday's Three Peaks and a Domed House formation in the Dow Industrials. You can find my most recent post on this subject here. And here is the link to all of my George Lindsay posts.

The first chart above this post is a highly condensed daily bar chart which shows both these Three Peaks and a Domed house formations. The blue numbering identifies the turning points of the major formation. These numbers correspond to the turning points in the schematic of the ideal formation which you can see above this post. The blue numbered formation is a major one because the time from peak 3 to peak 7 is at least 6 months.

The second chart above this post is a close-up look at the second example of the Three Peaks and a Domed House formation. The turning points of this formation are identified by the red numbers. This is a minor formation because peaks 3 and 7 are separated by fewer than 6 months.

At this juncture I have more confidence in the minor formation with the red numbering than in the major formation. There are two reasons.

First, in the major (blue) formation, point 27 exceeds point 23. This is very unusual, although I had predicted that blue point 27 would indeed exceed blue point 23. Also, blue point 6 is below blue point 10. This is an allowed departure from the schematic but more often one finds point 1o below point 6. These two departures from the schematic reduce my confidence in the blue formation.

My second reason is that the major formation predicts a drop to Dow 9800 over the next 6 months or so. It is my view that such a drop would amount to more than 20% from the upcoming high. I happen to believe that most market participants are ready to turn bearish at the drop of a hat and that consequently there is little chance that the next drop will exceed 15%.

On the other hand the red formation predicts that the drop from red point 23 will only carrry the Dow down to 10600 or so. I find this a more plausible target.

As I have noted on the chart I think that we have seen point 21 in the red formation and that the rally to the peak of the domed house at point 23 is underway. I think this top will develop near Dow 12500. The 7 month 10 day time span counted from red point 6 predicts that point 23 will develop on November 27.

There is one fly in this ointment. So far I see no convincing evidence of points 15-20 in the red formation. There have been important formations in the past that did not show any obvious points 15-20. But I also think that the "momentum peak" for the rally from the July 2006 low (red point 10) was reached in late October. Generally speaking such momentum peaks can easily preceed the price top by two or three months. So there is ample room for more upside activity into December or even January. The bottom line is that red point 21 on the chart may in fact only be red point 15. If so I would have to count 7 months and 10 days from either red point 10 or red point 14. This then would imply a price peak at red point 23 on February 28 or March 21 in 2007.

It doesn't really matter that much whether or not point 23 occurs on November 27 or instead on February 28 or March 21 of next year. I think any price gains between November 27 and March 21 will be limited in comparison to the gains from red point 10 through the end of November. So in any case it makes sense to adopt a less bullish posture by the end of the month and expect the next break to last several months and carry the market down to its July 2006 low near 10600.