Tuesday, February 28, 2006

S&P Update


Here is an updated hourly chart showing regular hours trading in the March E-mini futures.

The market has stalled at the first support level I discused this morning, but volume is still relatively high. I think this means that we are about to see a rally to a lower top around 1288 and then a second break down to 1273 or so.

I remain confident that the market will reach the 1350 level by the end of April.

Google


Here is a 15 minute chart of Google showing its activity after the 337 low following the Barron's article two weeks ago. This morning Google's CFO tried to deflate expectations of an ever growing (!!!!) growth rate by observing that as GOOG grew its growth rate was declining. Typical of every business I've ever seen.

But as you can see on the chart traders shoot first and ask questions later. In less that half an hour GOOG dropped almost 60 points, all the way back to 338. It is too early to tell from market activity whether 337 will hold or not. My own guess is that it will hold or be broken by only a couple of points. My reason is that the 337 level is just a little below very strong support at 347 and is itself strong support for other reasons. Plus this break occurred on very high volume but didn't drop below 337 (so far). This gives it the appearance of climatic selling on news which typically occurs near the end of a trend rather than near its beginning.

S&P


Here is an hourly chart of regular hours trading in the March S&P E-mini futures.

This morning I said that the 1285 level would be support but the market's action so far today is telling me that 1285 will not hold. Why?

First, most corrections have two distinct downward phases separted by a very visible rally to a lower top. So far this correction shows only one downward phase. Second, the volume on this break has been substantially higher than the volume on the previous two breaks. This shows up very clearly on the second chart above this post which records trading over the past month in 15 minute bars. The volume pattern is characteristic of a market in the middle of a move, not near the end of one.

How far down will the correction carry? One guess is 1280 or so, but for this to work we must see an obvious upward move first plus a clear volume reduction near the low. My second choice for support is the 1273 level and right now this is looking to be the more likely of the two choices.

Guesstimates on February 28 , 8:50 am ET

March S&P Futures:  Support is still at 1285 while the next minor resistance is 1304. The market should reach the 1350 level by late April.  

June Bonds: The next downside target is at 111-16 while resistance today is again at 113-08. I think the market is on its way into the 107-108 zone.

June 10 Year Notes: Resistance is at 108-04 while the next support level beneath the market is at 107-10. I think notes will reach 104 or so in a few months.

Cash Eurocurrency: The next downside target is117.20 while resistance is still at 119.80. A drop to 113 and below is underway.    

April Crude: The market is on its way to 57.20 Crude is headed for 52.00 and eventually lower than that.

April Gold: I think a drop of $100 is underway. Resistance today is again at 562. Next support on the way down is at  512.  

March Silver: I think a drop of $2.00 is underway. Resistance today is again at 972. Next short term support is at 860.

Google: Short term resistance above the market is at 405 while support is at 378. Once GOOG leaps over resistance at 405 it will be headed for the next upside target at 495.

Monday, February 27, 2006

Bonds


Here is an hourly chart showing pit trading in the March T-bond futures. I shall be switching to the June contract tomorrow but because the yield curve is slightly inverted there is no spread between the March and June contracts.

It looks to me like the market is about to break downward out of the past month's trading range. There will probably be a brief stop near 111-16 but I expect to see the bonds trading near 110-12 very soon.

Google


Here is an hourly chart showing regular hours trading in Google.

I think the 385 level is minor resistance. Whenever a market reaches a support or resistance level, especially one that is within an obvious trading range, it is generally good practice to see if the market is giving any confirming indication that it will indeed bounce off of that level.

On the Google chart I have labeled the extremes of the recent swings. Notice how the successive upswings a-b, c-d, and e-f have grown progressively shorter in extent and duration. Notice too how each successive upthrust occurred on less volume than the previous one.

Both these indications are signs of weakness and indicate to me that the 385 level will produce a reaction of at least 10-20 points. But I am still very bullish on GOOG and so I am willing to let the market contradict these indications. So an hourly close at 390 or higher would tell me that the market has to reach 405 before any substantial correction will occur.

Crude Oil


Here is an hourly chart showing pit trading in April crude oil futures.

I was expecting the market to rally from 60.20 to 63.50 but it never made it to the upside target. Now I think a move down to 57.20 has started.

This activity is part of a bigger down trend which I think will carry the market to 52.00 and eventually lower than that.

Guesstimates on February 27 , 8:50 am ET

March S&P Futures:  Support is still at 1285 while the next minor resistance is 1304. The market should reach the 1350 level by late April.  

March Bonds: The next downside target is at 111-16 while resistance today is again at 113-08. I think the market is on its way into the 107-108 zone.

March 10 Year Notes: Resistance is at 108-04 while the next support level beneath the market is at 107-10. I think notes will reach 104 or so in a few months.

Cash Eurocurrency: The next downside target is117.20 while resistance is still at 119.80. A drop to 113 and below is underway.    

April Crude: I still think it will reach 63.50 before beginning a drop to 57.20. Crude is headed for 52.00 and eventually lower than that.

April Gold: I think a drop of $100 is underway. Resistance today is again at 562. Next support on the way down is at  512.  

March Silver: I think a drop of $2.00 is underway. Resistance today is again at 972. Next short term support is at 860.

Google: Short term resistance above the market is at 385 while support is at 364. Once GOOG leaps over resistance at 405 it will be headed for the next upside target at 495.

Friday, February 24, 2006

USD / Euro


Here is an hourly chart of the cash US dollar /Euro currency pair.

The market has held below resistance at 119.80 the past couple of days and I think will soon reach its next downside target at 117.20 (revised downward from 117.90).

Gold and Silver


Here are hourly charts showing pit trading in April gold and March silver futures.

Both markets have reached resistance and the next big move from here will be downward to 512 in gold and 860 in silver.

Crude Oil


Here is an hourly chart showing pit trading in April crude oil futures.

The market is approaching the 63.50 target I cited yesterday. The next big move will be downward to 57.20.

Guesstimates on February 24 , 8:50 am ET

March S&P Futures:  Support is still at 1285 while the next minor resistance is 1304. The market should reach the 1350 level by late April.  

March Bonds: The next downside target is at 111-16 while resistance today is again at 113-08. I think the market is on its way into the 107-108 zone.

March 10 Year Notes: Resistance is at 108-04 while the next support level beneath the market is at 107-10. I think notes will reach 104 or so in a few months.

Cash Eurocurrency: The next downside target is117.90 while resistance is at 119.80. A drop to 113 and below is underway.    

April Crude: The market dropped as low as 59.70 yesterday but this morning has made it as high as 62.60. I still think it will reach 63.50 before beginning a drop to 57.20. Crude is headed for 52.00 and eventually lower than that.

April Gold: I think a drop of $100 is underway. Resistance today is again at 562. Next support on the way down is at  512.  

March Silver: I think a drop of $2.00 is underway. Resistance today is again at 972. Next short term support is at 860.

Google: GOOG has recovered strongly above the 350 level.  Short term resistance above the market is at 385 while support is at 364. Once GOOG leaps over resistance at 405 it will be headed for the next upside target at 495.

Thursday, February 23, 2006

Crude Oil


Here is an hourly chart showing pit trading in April crude oil futures.

The market has dipped a little below what I think is support at 60.20. My best estimate is that it will next rally to 63.50. After that a drop to 57.20 will become likely.

S&P Update


Here is an hourly chart showing pit trading in the March S&P futures.

After the first 90 minutes of trading today the market had dropped to 1286.70 and then rallied to 1292.00. At that point I said that I expected another break down to 1285 and that the market shouldn't spend much time above 1292.50 in the meantime.

As you can see from the chart we have spent a fair amount of time above the 1292.50 level so I must conclude that the next stop is 1304.

S&P


Here is an hourly chart showing pit trading in the March S&P futures.

I am very bullish on this market but the price action early this morning makes me think that the market will drop to 1285 today before it can rally to 1304. If I am right then the market should not spend much time above the 1292.50 level.

T-bonds


Here is an hourly chart showing pit trading in the March T-bond futures.

The market has done nothing for the past month but I think this is about to change. My reading of trading sentiment is that there is too much bullishness around to justify the expectation of a solid advance from current levels. So I am looking for a drop to 110-12 which will be briefly interrupted by a rally from the 111-16 level.

Eurodollars


Here is a daily chart of the September eurodollar futures (interest rate, not currency!)

I've drawn the 48 tick bear market boxes that have controlled the downtrend from the 99.09 top of June 2003. I think the market will reach the 94.30 level sometime this year and then begin a mutli-year rally.

Guesstimates on February 23 , 8:50 am ET

March S&P Futures:  Support is at 1285 while the next minor resistance is 1304. The market should reach the 1350 level by late April.  

March Bonds: The next downside target is at 111-16 while resistance today is again at 113-08. I think the market is on its way into the 107-108 zone.

March 10 Year Notes: Resistance is at 108-04 while the next support level beneath the market is at 107-10. I think notes will reach 104 or so in a few months.

Cash Eurocurrency: The next downside target is117.90 while resistance is at 119.80. A drop to 113 and below is underway.    

April Crude: The market should hold 60.20 and then rally to 63.50.  After that the next downside target will be 57.20. Crude is headed for 52.00 and eventually lower than that.

April Gold: I think a drop of $100 is underway. Resistance today is again at 562. Next support on the way down is at  512.  

March Silver: I think a drop of $2.00 is underway. Resistance today is again at 972. Next short term support is at 860.

Google: GOOG has recovered strongly above the 350 level.  Short term resistance above the market is at 385 while support is at 364. Once GOOG leaps over resistance at 405 it will be headed for the next upside target at 495.

Wednesday, February 22, 2006

Gold and Silver


Here are hourly charts showing pit trading in March silver and April gold.

I think both markets are headed much lower.

Yesterday I thought the rallies from last week's lows had ended but today's strength suggests slightly higher resistance levels: 562 in gold and 972 in silver. The next downside targets are 512 for gold and 860 for silver.

Chicago Merchantile Exchange


Here is a daily chart of CME.

This stock has been a bull market leader ever since its IPO and shows no sign of faltering.

CME has exceeded my long standing target at 411 and should rally further to 441. This latter target may well prove to be too conservative.

Board of Trade


Here is a daily chart of the Chicago Board of Trade.

I last commented on BOT here. BOT has rallied since early January and I am impressed by the stock's ability to move upward while the rest of the market reacted that month and early this.

I think BOT will make a new high around 142 before the bull market in the general averages ends.

Crude Oil


Here is an hourly chart showing pit trading in April crude oil futures.

I am not quite ready to give up on my revised 63.50 rally target, largely because most reactions within a downtrend have two distinct upward phases and so far we have only seen one. So I am willing to guess that the break from yesterday's high at 62.95 will halt near 60.20 and then be followed by a rally to 63.50.

In any even the most important thing to keep in mind is that crude is in a bear market which will carry prices down to $52.00 and probably much lower than that.

Guesstimates on February 22 , 8:50 am ET

March S&P Futures:  I think the market held support at 1283 yesterday and will now head higher. Next resistance is at 1304. The market should reach the 1350 level by late April.  

March Bonds: The next downside target is at 111-16 while resistance today is again at 113-08. I think the market is on its way into the 107-108 zone.

March 10 Year Notes: Resistance is at 108-04 while the next support level beneath the market is at 107-10. I think notes will reach 104 or so in a few months.

Cash Eurocurrency: The next downside target is117.90 while resistance is at 119.80. A drop to 113 and below is underway.    

April Crude: The  63.50 level is again resistance. The next downside target is 57.20. Crude is headed for 52.00 and eventually lower than that.

April Gold: I think a drop of $100 is underway. Resistance today is again at 556. Next support on the way down is at  512.  

March Silver: I think a drop of $2.00 is underway. Resistance today is again at 950. Next short term support is at 860.

Google: GOOG has recovered strongly above the 350 level.  Short term resistance above the market is at 380 while support is at 345. Once GOOG leaps over resistance at 405 it will be headed for the next upside target at 495.

Tuesday, February 21, 2006

Crude Oil


Here is an hourly chart showing pit trading in April crude oil futures.

The market has rallied more than I originally expected but the rally still is within normal bounds for a reaction against the downtrend. I now think it will halt at 63.50 resistance and then drop to 56.00.

Silver


Here is a chart showing pit trading in March silver futures.

I thought the rally would stop at 950 but it continued up to 958. You can see the narrow ranges associated with trading above the 950 level. This tells me that the break past resistance elicited little interest and makes me confident that the next development will be a break to support around 860.

S&P


Here is an hourly chart of pit trading in the March S&P futures.

The market didn't quite make it up into the 1295-1300 zone this morning and the first hour break makes me think the market will stay below 1290 the rest of the day and react to 1283 or so and possibly as low as 1276. In any case I still think the big opportunities here are on the long side and that the market will soon be trading near 1320.

Guesstimates on February 21 , 8:50 am ET

March S&P Futures:  I think the market is headed for 1320. The 1280 level is still support but is looks like the market will trade into the 1295-1300 zone before any break of as much as 10 points can develop. The market should reach the 1350 level by late April.  

March Bonds: The next downside target is at 111-16 while resistance today is at 113-08. I think the market is on its way into the 107-108 zone.

March 10 Year Notes: Resistance is now at 108-04 while the next support level beneath the market is at 107-10. I think notes will reach 104 or so in a few months.

Cash Eurocurrency: The next downside target is117.90 while resistance is at 119.80. A drop to 113 and below is underway.    

April Crude: The market has rallied more than I expected but today the  63.50 level is resistance. The next downside target is 57.20. Crude is headed for 52.00 and eventually lower than that.

April Gold: I think a drop of $100 is underway. Resistance today is again at 556. Next support on the way down is at  512.  

March Silver: I think a drop of $2.00 is underway. Resistance today is again at 950. Next short term support is at 860.

Google: GOOG has recovered strongly above the 350 level.  Short term resistance above the market is at 380 while support is at 345. Once GOOG leaps over resistance at 405 it will be headed for the next upside target at 495.

Friday, February 17, 2006

S&P


Here is an updated hourly chart showing pit trading in the March S&P futures.

Yesterday afternoon I said that a reaction of 12 points or so was likely in the S&P from the 1289 level. After that post was written the market rallied further to 1292.75 on heavy volume. This was probably a small buying climax but it is also a sign of strength so I think the upcoming reaction will probably be only 10 points or so and carry down to 1283.

If this proves too optimistic then I'd say that 1276 is a less probable but still viable reaction target.

In either event the swing up to 1320 and eventually to 1350 is still in good shape and I think the next two months will be bullish ones.

Guesstimates on February 17 , 8:50 am ET

March S&P Futures:  I think the market is headed for 1320. The 1280 level should be support today. The market should reach the 1350 level by late April.  

March Bonds: The next downside target is at 111-16 while resistance today is at 113-08. I think the market is on its way into the 107-108 zone.

March 10 Year Notes: Resistance is now at 108-04 while the next support level beneath the market is at 107-10. I think notes will reach 104 or so in a few months.

Cash Eurocurrency: The next downside target is117.90 while resistance is at 119.80. A drop to 113 and below is underway.    

April Crude: Resistance today is 61.80 and the next downside target is 57.20. Crude is headed for 52.00 and eventually lower than that.

April Gold: I think a drop of $100 is underway. Resistance today is 556. Next support on the way down is at  512.  

March Silver: I think a drop of $2.00 is underway. Resistance today is at 950. Next short term support is at 860.

Google: GOOG has recovered strongly above the 350 level.  Short term resistance above the market is at 380 while support is at 345. Once GOOG leaps over resistance at 405 it will be headed for the next upside target at 495.

Thursday, February 16, 2006

S&P


Here is a line chart of prices at 15 minute intervals in the March E-mini S&P futures.

It looks to me like the market is about to start a reaction of 12 points or so. Here is my reasoning.

First the market has approached the previous high at 1291.75 of January 30 which was followed by a 35 point break. So traders naturally key on such points as opportunities to take the opposite side of the current trend, at least if there are other reasons for fading it too.

In this instance I think there are indeed reasons to suspect that we will see a break of a day or two. Notice how the upswings are growing shorter: g to h has been shorter than e to f and the point h was about 7 points higher than f while f was about 10 points higher than d.

Of equal significance is the fact that the volume of trading showed a marked tendency to decrease on the advance from g to h in contrast to its tendency to rise on the previous advance from e to f.

So at this juncture I would expect a break comparable to d to e which was about 13 points.

Lindsay Low-Low-High Counts


Here is a daily chart of the Dow Industrials.

My approach to markets does not place much emphasis on predicting when highs and lows are likely to occur. Instead I prefer to indentify the support or resistance levels where they are likely to occur.

Even so, one can sometimes make educated guesses about when highs and lows are likely to occur. I find that George Lindsay's methods enable one to do this for the US stock market averages.

One of his techniques is illustrated in the daily chart of the Dow you see above this post. The idea is that by counting the calendar days that separate two low points and then adding the result to the date of the second low one often gets very close to the date of a succeeding high. This is called a low-low-high count.

The April 20, 2005 low in the Dow is labelled a in the chart above. The next obvious low is the October 13, 2005 low which occurs 176 days later at aa. Adding 176 days to October 13 one arrives at April 7, 2006, point aaa, as the date of a likely high. Note that this agrees with the ideal date of one of Lindsay's top-to-top counts.

Starting at the October 13, 2005 low as point b we find that 99 days later the Dow has made another low at point bb on January 20, 2006. Adding 99 days to January 20 we arrive at point bbb, April 29, 2006. This also coincides with a top-to-top count and late April remains my perferred time frame for the end of the current bull market.

The Google Test


The latest issue of Barron's had a bearish cover story on Google. I commented on it here.

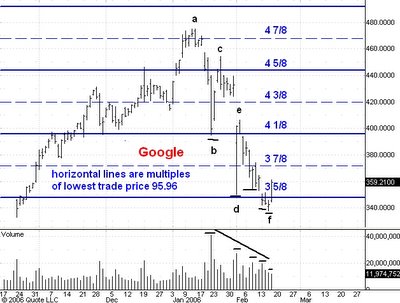
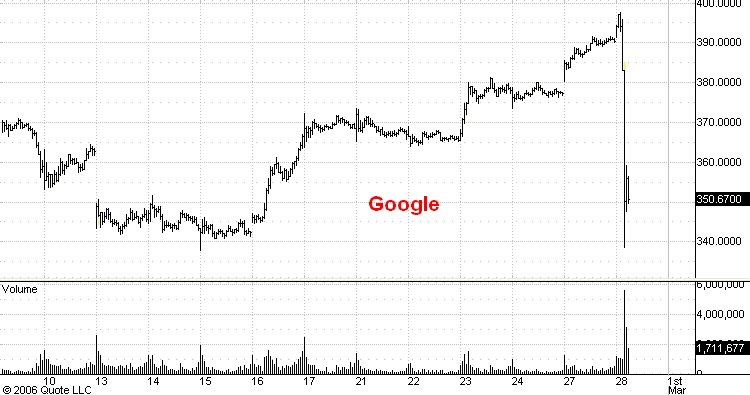
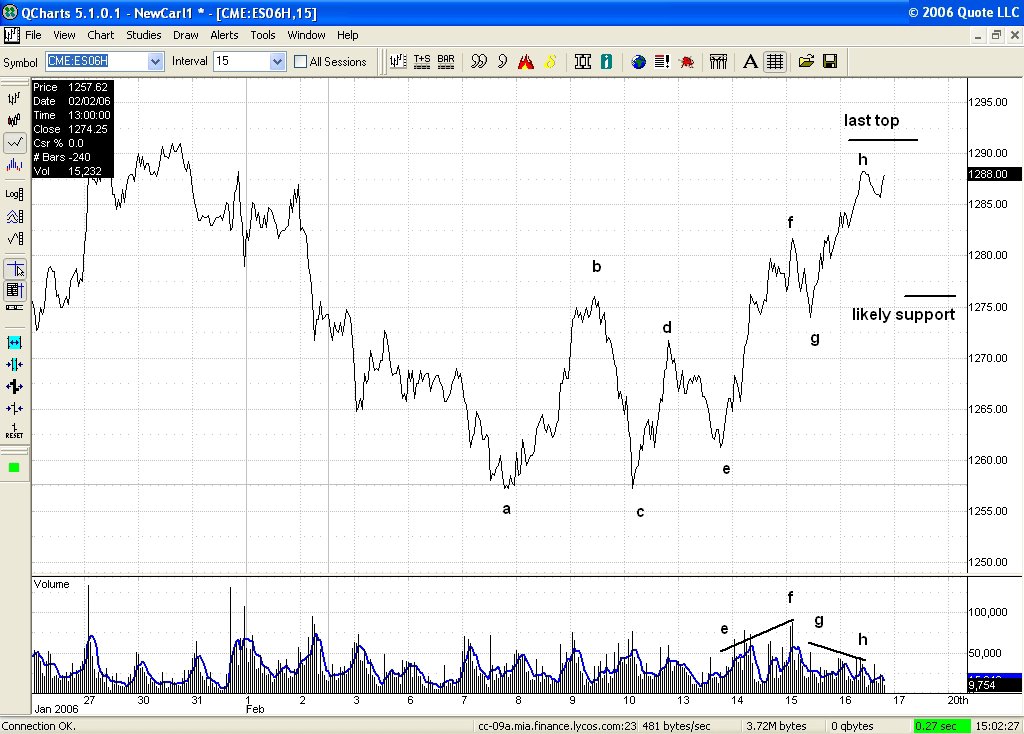
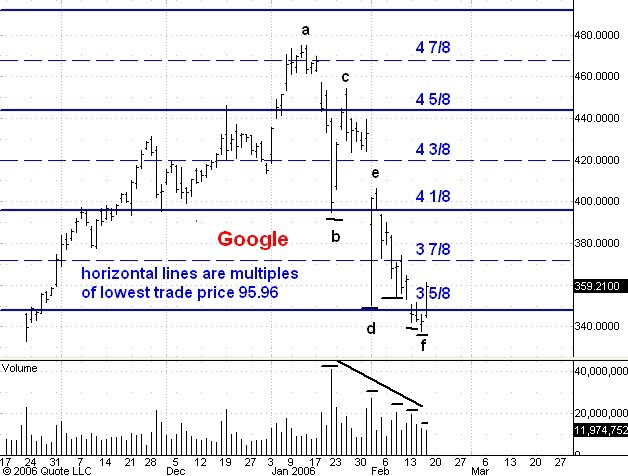
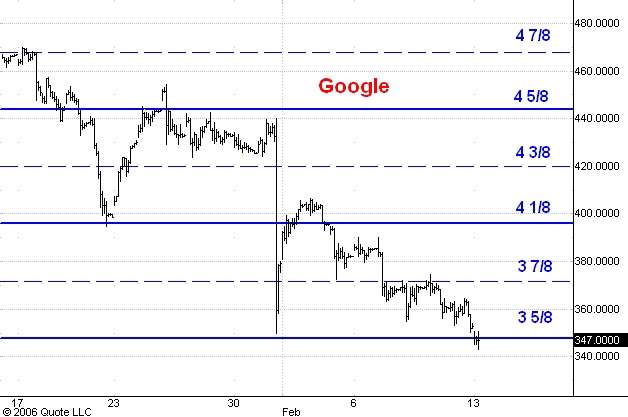
As I said in that post, I think the most interesting thing about the story is that is is providing us with a test of the technical condition of both GOOG and of the general market. The chart above this post is a daily chart of trading in GOOG with the volume numbers below. I took the liberty of extending the bar of the day of the latest earnings announcement down to the after-hours low at 350.

From a tape-reading perspective there are several things about GOOG's activity that interest me.

First, the last down swing from e to f was shorter than the previous two. Moreover, it only broke the low of the c to d swing by 12 points or so while the the previous low at d was 45 points below the low of its preceeding swing from a to b. The bullish implication of this sort of swing shortening is emphasized because both d and f occurred close to very strong support at the 3 5/8 multiple of the all time tading low of 95.96.

Secondly, we note that the successive volume levels at temporary lows on the way down have been dropping. I have shown these days on the chart with horizontal black lines. The behavior of volume is supporting the evidence of the shortening downswings and is telling us that selling pressure has been dropping as GOOG descended to the 337 level.

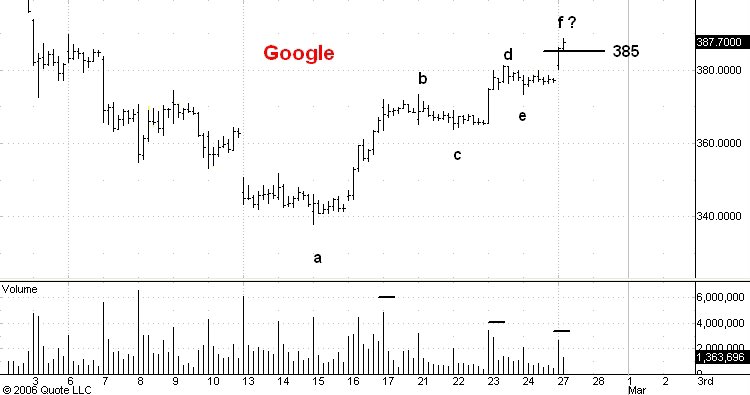
Finally, the volume on Monday, the day after the Barron's story, was lower than at any of the preceeding temporary lows and the voume on the day of the 337 low at f was even lower than that. This tells me that the Barron's story couldn't force many more sellers into the market and this means that the majority of GOOG's floating supply is now held by people who can't be spooked by bearish news stories. This is a very bullish indication.

I'd say that GOOG has passed the Barron's test with flying colors.

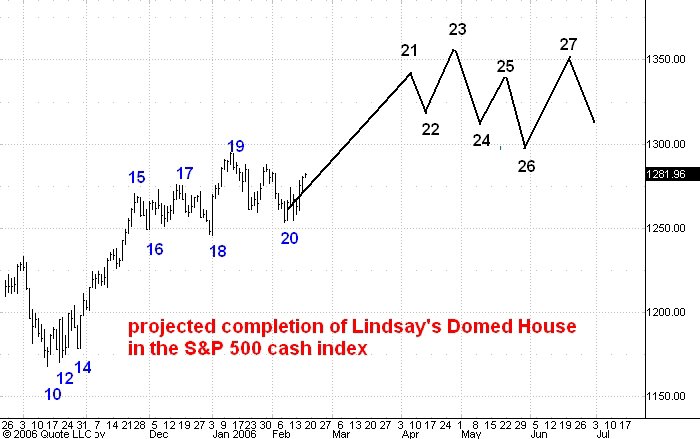
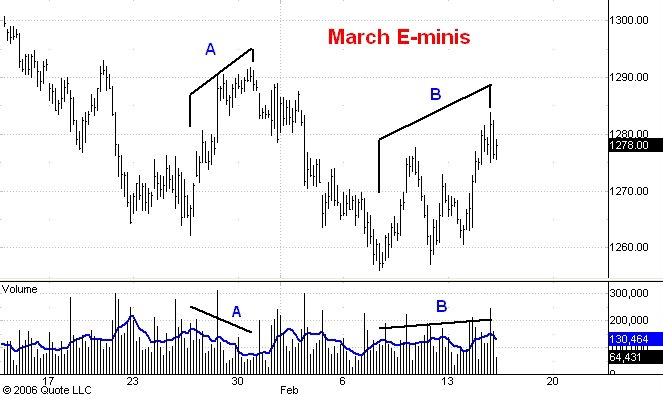
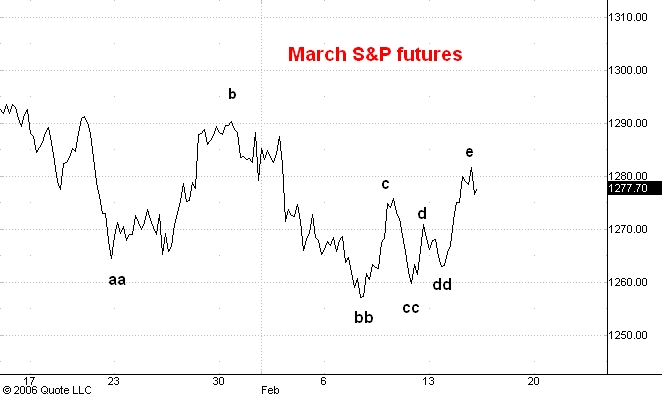
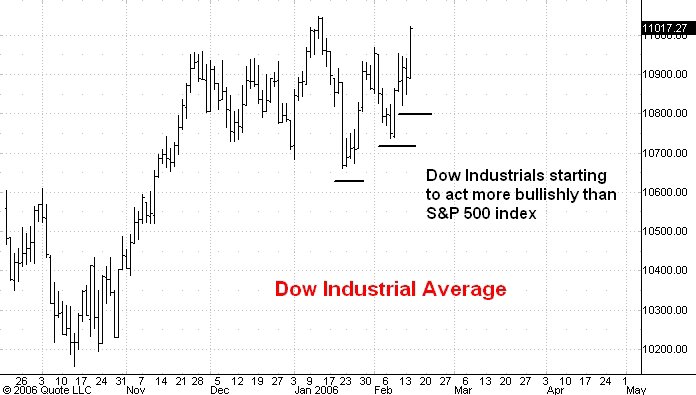
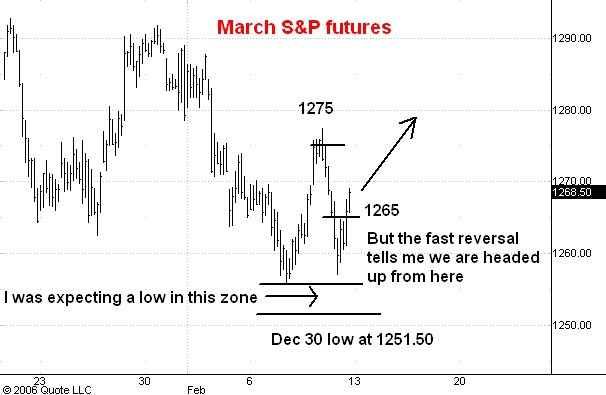
What about the market averages? Well, GOOG has been the bull market leader since its IPO in August 2004. When the bull market leader gets shot down like GOOG has one would expect the averages to drop too. Now GOOG's high on Jan 12 occurred a day after the high of the averages on January 11. But the Dow is now at new bull market highs. And the S&P is trading above the level it had reached when GOOG established point e on the chart.

All in all, I think both GOOG and the general market passed the test of the Barron's story and this has very bullish implications for both.

Domed House Update


Here is a daily chart of the cash S&P 500. It depicts what I think is the current position of the market within the domed house portion of Lindsay's Three Peaks and a Domed house formation.

I last commented on this here and here. Lindsay fans might want to take a look at these posts.

As you can see on the chart I believe that the market has completed the "five reversals" portion of the domed house and that it has begun its "second story" advance. It is on track to put in a late April high near the 1350 level.

Guesstimates on February 16 , 8:50 am ET

March S&P Futures: I think the market is headed for 1320. The 1271 level should again be support today. The market should reach the 1350 level in a couple of months.

March Bonds: The next downside target is at 111-16 while resistance today is at 112-16. I think the market is on its way into the 107-108 zone.

March 10 Year Notes: Resistance is now at 108-04 while the next support level beneath the market is at 107-10. I think notes will reach 104 or so in a few months.

Cash Eurocurrency: The next downside target is117.90 while resistance is at 119.80. A drop to 113 and below is underway.

April Crude: The market will probably drop a bit below 58.00 before a rally of as much as $3 develops. Crude is headed for 52.00 and eventually lower than that.

April Gold: I think a drop of $100 is underway. Resistance today is 556. Next support on the way down is at 512.

March Silver: I think a drop of $2.00 is underway. Resistance today is at 950. Next short term support is at 860.

Google: GOOG has traded below 348 for three days now but I think short term support at 341 will halt the slide and that we will see a strong recovery above the 350 level. Once GOOG leaps over resistance at 405 it will be headed for the next upside target at 495.

Wednesday, February 15, 2006

Silver


Here is an hourly chart showing pit and electronic trading in March silver futures.

The market bounced off of 941 resistance early this morning but I am guessing we have seen only the first upward phase of a three phase rally. So there is a good chance that the market will rally to the 950 level before it drops to the next support near 850.

Gold


Here is a line chart showing hourly closes in pit and electronic trading for April gold futures.

Most rallies in a downtrend are three stage affairs: two upward phases separated by a down movement. Right now it looks like we have seen only the first upward phase in gold so I think there is still a good chance that the market will make it up to 555 before dropping to the next support level near 526.

Crude Oil


Here is a line chart showing hourly closes during pit trading in the April crude oil futures. The chart goes all the way back to the Katrina high of late August of last year.

At the recent high just after the president's State of the Union message I observed that oil angst was at a peak comparable to the peak seen at the Katrina top. Since then oil has dropped more than $9 per barrel and I think it will drop to $52 or even lower before a substantial rally interrupts the decline.

I thought we would see bounce in April crude from the 60.80 level but evidently the inventory numbers put a scare into the market this morning. You can see from the line chart that the drop from 69.90 in early February has accelerated and shows no sign yet of slowing down. I think this meanst that we will see April crude in the $57-58 range before a rally of more than 3 dollars develops.

S&P Volume and Swings


The first chart you see above this post shows the hourly closes in the March S&P futures together with labels which denote the swing extremes I think are relevant. Yesterday I discussed some considerations useful for analyzing such a chart.

Right now the upswing from cc to e has exceeded in time and extent the preceeding upswing from bb to c. This tells me that the entire swing up from from bb is incomplete. Since it is already almost as long as the swing up from aa to b I conclude that it will soon exceed the latter swing and when it does we will have (late) confirmation that the low at bb ended the reaction from the January 11 top.

The second chart above this post is a hourly chart of pit activity in the March E-mini S&P futures. One thing I like about electronic contracts like this one is that one gets real time volume of trading numbers instead of "tick" volume numbers. These volume numbers appear as bars at the bottom of the chart and the blue line is a 7 period moving average of the volume bars.

One of the principal tenets of technical analyis is that volume shows the trend. In other words, as a trend progresses it tends to show an increase in trading volume. If this doesn't happen one has a warning that the trend may be near its end. In general, comparing volume on succeeding swings often is a way to get an early read on the possiblity of a trend reversal.

On the chart of the E-minis I have compared the volume trend on the current swing up from point bb to the preceeding swing up from point aa to point b. The blue letters B identify the price and volume trends for the upswing from bb while the blue letters A do the same for the upswing from aa.

The important observation here is that volume has shown a definite tendency to increase on the rally from bb while on the rally from aa it showed a definite tendency to decrease. This tells me that the swing up from bb is the "real deal" and that new bull market highs will soon be seen in the S&P.

Guesstimates on February 15 , 8:50 am ET

March S&P Futures:  I think the market is headed for 1320. The 1271 level should be support today. The market should reach the 1350 level in a couple of months.  

March Bonds: The next downside target is at 111-16 while resistance today is at 112-16. I think the market is on its way into the 107-108 zone.

March 10 Year Notes: Resistance is now at 108-04 while the next support level beneath the market is at 107-10. I think notes will reach 104 or so in a few months.

Cash Eurocurrency: The next downside target is117.90 while resistance is at 119.80. A drop to 113 and below is underway.    

April Crude: Support is at 60.80 and the market will now probably rally to 62.50 before turning lower again. Crude is headed for 52.00 and eventually lower than that.

April Gold: I think a drop of $100 is underway. Resistance today is 556. First minor support on the way down is at 526.

March Silver: I think a drop of $2.00 is underway. Resistance today is at 940. Next short term support is at 895.

Google: I still don’t think this bull market is over and I think we’ll see GOOG hold support at 348, the 3 5/8 multiple of the lowest trade price, 95.96. Once GOOG leaps over resistance at 405 it will be headed for the next upside target at 495.

Tuesday, February 14, 2006

S&P Swings


Here is a line chart of the hourly closes of in the March S&P futures.

One way to judge a market's technical condition is to compare the length, duration and velocity of its swings. I like to use line charts like this one for this purpose although sometimes the bar chart reveals the successive swings more clearly.

In the S&P futures you can see two successive downswings from the January top of 1301; these are labelled a to aa and b to bb on the chart. These downswings were about equal in length and duration and at point bb the entire reaction had assumed the commonly observed form of a zig-zag downward.

The first sign that the reaction was over occurred when the third downswing from c to cc ended above point bb and was shorter than both preceeding downswings. Then the fourth downswing from d to dd was even shorter and established a second consecutive higher low after the pretty severe break ending at bb. A reasonable inference at this point was that a turn was at hand if the market could move upward from point dd.

In fact the next upswing from dd to e was longer in points and in time that the one from cc to d. This makes me think that this the move up from from cc is not yet over and that when it is complete the whole swing upward from cc will be longer in time and price than the one from bb to c.

If this deduction proves correct then it would be reasonable to guess that the upswing from bb which so far has reached e will soon exceed in price and in time the upswing from aa to b. This in turn would be convincing evidence that new bull market highs lie dead ahead.

Crude Oil


Here is an updated hourly chart showing pit and electronic trading in the March crude oil futures. Tomorrow I will be switching over to the April contract which is trading about $1.20 over March, so adjust the numbers below accordingly.

March crude has entered its support zone of 59.80 to 60.20 and the next development should be a rally of 2 to 3 dollars. After this rally I think the market will continue on its way down. I think it will drop at least to $52 before there is much chance of a rally of more than $5.

Dow vs. S&P


Here are daily charts of the cash Dow industrials and the S&P 500.

A few days ago I commented on the growing relative strength shown by the Dow compared to the S&P. This has continued and today the Dow is very near its bull market high established on January 11 at 11047.

Notice the three successive higher lows in the Dow recently. I have drawn lines under the three corresponding lows in the S&P too. You can see clearly that the Dow has been strengthening relative to the S&P. This sort of trend in relative performance tends to last quite a while once it starts and I think this tells us that the big cap stocks of the Dow are about to assume leadership in this aging bull market. This will certainly send all the broad based averages quite a bit higher than they are today.

Guesstimates on February 14 , 8:50 am ET

March S&P Futures:  I think the market is headed for 1320. The 1263 level should still be support today. The market should reach the 1350 level in a couple of months.  

March Bonds: The next downside target is at 111-16 while resistance today is at 112-16. I think the market is on its way into the 107-108 zone.

March 10 Year Notes: Resistance is now at 108-04 while the next support level beneath the market is at 107-10. I think notes will reach 104 or so in a few months.

Cash Eurocurrency: The next downside target is117.90. A drop to 113 and below is underway.    

March Crude: Next downside target is at 59.70 ? 60.20 zone. Crude is headed for 55.00 and eventually lower than that.

April Gold: I think a drop of $100 has begun. Resistance today is 556. First minor support on the way down is at 526.

March Silver: I think a drop of $2.00 has started. Resistance today is at 940. Next short term support is at 895.

Google: The Barron’s cover story on GOOG will provide us with a good test of the market.  I still don’t think this bull market is over and I think we’ll see GOOG hold support at 348, the 3 5/8 multiple of the lowest trade price, 95.96. Once GOOG leaps over resistance at 405 it will be headed for the next upside target at 495.

Monday, February 13, 2006

S&P


Here is an updated hourly chart of the March S&P futures.

After declining slowly all day the market has staged a late rally which has taken it back above the 1263 support level. I think this is a sign that tomorrow will be a bullish day and that the February 7 low at 1256 will hold.

I should also point out that today was a very dull day and I think this is a bullish sign in light of Barrons' Google cover which I discussed this morning.

Google Hourly Chart

Barron's Cover

Google - the Sinking Ship?

Here is a picture of yesterday's Barrons cover and here is a link to their cover story on Google. Above this post you will also see an hourly chart of GOOG.

The Barrons story is entitled "In the Drink" and the cover depicts Google's logo, modified to read "Gurgle", as a ship sinking beneath the waves. As you might imagine the story itself gives many reasons to be bearish on Google. In fact its lead paragraph says "... there could be a lot more tumbling ahead. The share price could well be cut in half over the next year....".

I would have a lot more confidence in Barrons' analysis if they had at any time published bullish stories on Google but I haven't been able to find one. It is important to keep in mind that big media are in the business of telling their readers what they want to hear. The typical Barrons reader is not someone who has been riding Google up from its IPO price of 85. And, having missed this boat, he is hoping to watch it sink beneath the waves. Hence this cover story.

The real import of Barrons' story is that it will provide us with a good test of the market's condition. I happen to think that most of the weak holders of GOOG have been shaken out of the stock by the steep, 25% drop after the latest earnings numbers. That drop carried GOOG down to 350 before it rallied to 406. The Barrons story so far has manage drop drop GOOG about 18 points from Friday's close to 343, only a little under the earnings number low of 350 and very near strong support at 348, the 3 5/8 multiple of the low price of 95.96.

I think we shall see a strong recovery back above the 350 level and that this will be the first stage of a move to 495.

Here is another important observation. GOOG has been the market's leader during the past 18 months. If the bull market is over a story like this one should send the general market lower. But if it fails to do this we will have a strong indication that the bull market is still in good shape and that much higher prices lie ahead. It is this latter outcome that I expect.

Guesstimates on February 13 , 8:50 am ET

March S&P Futures:  I think the market is now headed for 1320 and if so the 1263 level should be support today. The market should reach the 1350 level in a couple of months.  

March Bonds: Resistance is at 113-08 and the next downside target is at 111-16.  I think the market is on its way into the 107-108 zone.

March 10 Year Notes: Resistance is still at 108-18 while the next support level beneath the market is at 107-10. I think notes will reach 104 or so in a few months.

Cash Eurocurrency: The next downside target is117.90. A drop to 113 and below is underway.    

March Crude: Next downside target is at 59.70. Crude is headed for 55.00.

April Gold: I think a drop of $100 has begun. Resistance today is 561. First minor support on the way down is at 526.

March Silver: I think a drop of $2.00 has started. Resistance today is at 952. Next short term support is at 895.

Google: The Barron’s cover story on GOOG which came out yesterday will provide us with a good test of the market.  I still don’t think this bull market is over and I think we’ll see GOOG hold support at 348, the 3 5/8 multiple of the lowest trade price, 95.96. Once GOOG leaps over resistance at 405 it will be headed for the next upside target at 495.

Friday, February 10, 2006

Cash Euro-USD


Here is an hourly chart of the cash Eurocurrency-US dollar.

The market only mangage a rally of about 100 points from support near 119.50. I think it is now headed down into the 117.60-118.20 range from which levels we should see another 100-200 point rally.

Dow Relative Strength


Over the past few weeks I have noticed that the Dow Jones Industrial average is starting to act more bullishly than the S&P 500 index. This shows up on the daily chart above this post. The three successive higher lows marked by the black lines show bigger percentange increases over the preceeding low than does the similar chart of the S&P. This is telling me that the Dow stocks are about to lead the market higher, quite a change from the Dow doldrums of the past 2 years.

S&P update


Here is an updated hourly chart of the March S&P futures.

This morning I said that I thought the market would break below 1256 but hold above 1251.50 and then start a move to 1320. But the fast reversal we have seen has taken the market above yesterday's close and this tells me that this morning's low will hold and that the move to 1320 has started.

Hourly chart of March S&P

S&P

Here is an hourly chart showing pit trading in the March S&P futures.

I had been expecting a low around 1265 but this morning the market sank well below that level without any bounce at all. It now looks like the market will take out its last low at 1256 but will hold above the December low of 1251.50. I still think that the next big move will be upward to 1320 and above.

Guesstimates on February 10 , 8:50 am ET

March S&P Futures:  I am expecting a higher low near 1265 support and then a resumption of the move up to 1320. The market should reach the 1350 level in a couple of months.  

March Bonds: Resistance is at 113-08 and the next downside target is at 111-16.  I think the market is on its way into the 107-108 zone.

March 10 Year Notes: Resistance is still at 108-18 while the next support level beneath the market is at 107-10. I think notes will reach 104 or so in a few months.

Cash Eurocurrency: The market has recovered above the 119.50 level but will not go higher than 120.60.  The next downside target is117.60. A drop to 113 and below is underway.    

March Crude: Support is at 62.40 but the market will rally at most a dollar or two from there. Next downside target is at 59.70. Crude is headed for 55.00.

April Gold: I think a drop of $100 has begun. Resistance today is at 570. First minor support on the way down is at 526.

March Silver: I think a drop of $2.00 has started. Resistance today is at 966. Next short term support is at 905.

Google: I don’t think the bull market is over and I expect GOOG to hold support near 355 and then head higher. Once GOOG leaps over resistance at 405 it will be headed for the next upside target at 495.

Thursday, February 09, 2006

Gold


Here is an hourly chart showing pit and electronic trading in April gold futures.

The market rallied past what I thought would be resistance at 565. I think it will stop near 570, make a lower top and then resume its drop to 526.

S&P


Here is an updated hourly chart showing pit trading in the March S&P futures.

The market bounced off of resistance near 1275 today and I think it will make a low near support around 1265. From there I think the move to 1320 will resume.

Bonds


Here is an hourly chart of pit trading in the March T-bond futures.

The market has been stuck between support at 112-12 and resistance at 113-12 for a couple of weeks now. I think the market is about to make a lower top in the 113-08 to 113-12 range and then head down to 111-16. Over the next few months I am expecting a move down which will cary the bonds into the 107-108 zone.

Guesstimates on February 9 , 8:50 am ET

March S&P Futures:  The market has begun a move to 1320.  It will probably bounce off of 1275, dip into the 1260-65 range, and then continue its way upward. The market should reach the 1350 level in a couple of months.  

March Bonds: Resistance is now at 113-08 and the next downside target is at 111-16.  I think the market is on its way into the 107-108 zone.

March 10 Year Notes: Resistance is still at 108-18 while the next support level beneath the market is at 107-10. I think notes will reach 104 or so in a few months.

Cash Eurocurrency: The market has recovered above the 119.50 level but will not go higher than 120.60.  The next downside target is117.60. A drop to 113 and below is underway.    

March Crude: support today is at 62.40 but the market will rally at most a dollar or two from there. Next downside target is at 59.70. Crude is headed for 55.00.

April Gold: I think a drop of $100 has begun. Resistance today is at 565. First minor support on the way down is at 526.

March Silver: I think a drop of $2.00 has started. Resistance today is at 966. Next short term support is at 905.

Google: I don’t think the bull market is over and I expect GOOG to hold support near 355 and then head higher. Once GOOG leaps over resistance at 405 it will be headed for the next upside target at 495.

Wednesday, February 08, 2006

S&P


Here is an updated hourly chart showing pit trading in the March S&P futures.

I think the 1255 support level has held and that the market is on its way to 1320. Over the next couple of days it will probably bounce off of minor resistance near 1276 and then break 10-15 points to a higher low. Then an even stronger advance should begin.

Domed House Update


Here is a daily chart of the cash S&P 500 index.

As I discussed in this previous post I think the market is tracing out the domed house portion of George Lindsay's Three Peaks and a Domed House formation.

I have updated the chart and adjusted the labels a bit to to account for recent price action. As you can see I think the S&P low that I now see developing will end the "five reversals" part of the domed house. I am expecting the "second story" advance to carry the S&P up to 1350 and my best current guess is that the top will occur on April 25 or so instead of on April 5.