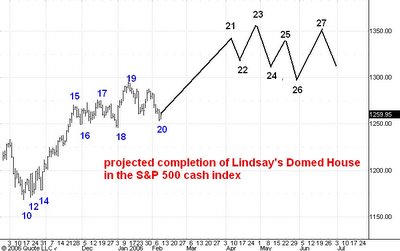
Here is a daily chart of the cash S&P 500 index.
As I discussed in this previous post I think the market is tracing out the domed house portion of George Lindsay's Three Peaks and a Domed House formation.
I have updated the chart and adjusted the labels a bit to to account for recent price action. As you can see I think the S&P low that I now see developing will end the "five reversals" part of the domed house. I am expecting the "second story" advance to carry the S&P up to 1350 and my best current guess is that the top will occur on April 25 or so instead of on April 5.
No comments:
Post a Comment