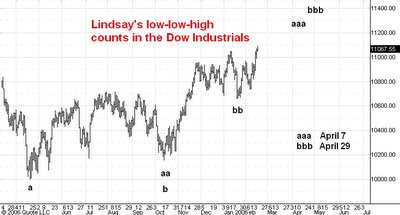
Here is a daily chart of the Dow Industrials.
My approach to markets does not place much emphasis on predicting when highs and lows are likely to occur. Instead I prefer to indentify the support or resistance levels where they are likely to occur.
Even so, one can sometimes make educated guesses about when highs and lows are likely to occur. I find that George Lindsay's methods enable one to do this for the US stock market averages.
One of his techniques is illustrated in the daily chart of the Dow you see above this post. The idea is that by counting the calendar days that separate two low points and then adding the result to the date of the second low one often gets very close to the date of a succeeding high. This is called a low-low-high count.
The April 20, 2005 low in the Dow is labelled a in the chart above. The next obvious low is the October 13, 2005 low which occurs 176 days later at aa. Adding 176 days to October 13 one arrives at April 7, 2006, point aaa, as the date of a likely high. Note that this agrees with the ideal date of one of Lindsay's top-to-top counts.
Starting at the October 13, 2005 low as point b we find that 99 days later the Dow has made another low at point bb on January 20, 2006. Adding 99 days to January 20 we arrive at point bbb, April 29, 2006. This also coincides with a top-to-top count and late April remains my perferred time frame for the end of the current bull market.
1 comment:
There is a low-low to high count due based on the lows of 1/3, and 2/7. 35 days added to 2/7 comes out to 3/14. On an earlier post I thought the top would be centered on 3/6 or so, but things seem closer to this time. The Dow appears to be finishing 5 waves up at a couple of degrees of trend, and the Nasdaq and S&P both seem to be towards the end of their coiling ending diagonal triangles.
There is also a Bradley turn date in this time frame, the source being the late Jerry Favors (the TA community lost one of the best IMHO).
The head and shoulders pattern on the NDX also bears watching.
All, IMHO.
Post a Comment