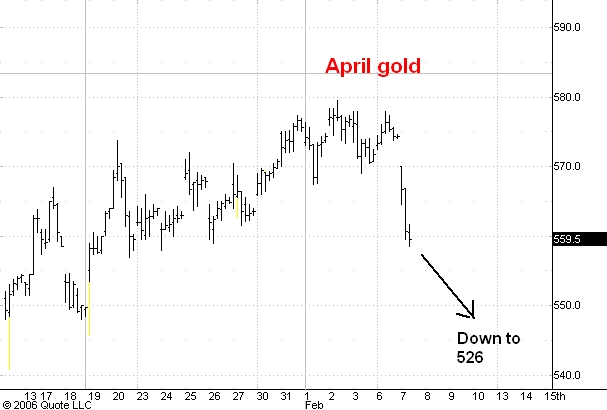
Here is an hourly chart showing pit trading in April gold futures.
As you can see the market today has broken decisively downward out of a multi-day trading range. I think this is the beginning of a move which will cary the market down $100 or so. Over the shorter term the first leg of this move down should find support around the 526 level.
No comments:
Post a Comment