
Here is an hourly chart of regular hours trading in the March S&P E-mini futures.
This morning I said that the 1285 level would be support but the market's action so far today is telling me that 1285 will not hold. Why?
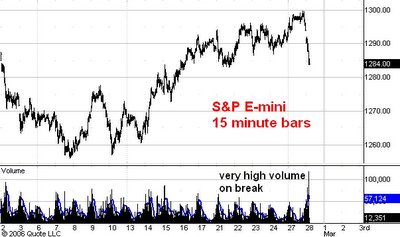
First, most corrections have two distinct downward phases separted by a very visible rally to a lower top. So far this correction shows only one downward phase. Second, the volume on this break has been substantially higher than the volume on the previous two breaks. This shows up very clearly on the second chart above this post which records trading over the past month in 15 minute bars. The volume pattern is characteristic of a market in the middle of a move, not near the end of one.
How far down will the correction carry? One guess is 1280 or so, but for this to work we must see an obvious upward move first plus a clear volume reduction near the low. My second choice for support is the 1273 level and right now this is looking to be the more likely of the two choices.
No comments:
Post a Comment