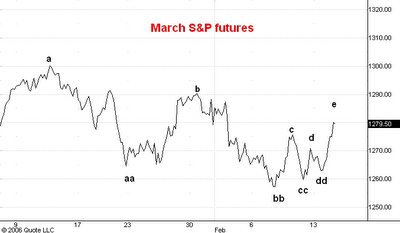
Here is a line chart of the hourly closes of in the March S&P futures.
One way to judge a market's technical condition is to compare the length, duration and velocity of its swings. I like to use line charts like this one for this purpose although sometimes the bar chart reveals the successive swings more clearly.
In the S&P futures you can see two successive downswings from the January top of 1301; these are labelled a to aa and b to bb on the chart. These downswings were about equal in length and duration and at point bb the entire reaction had assumed the commonly observed form of a zig-zag downward.
The first sign that the reaction was over occurred when the third downswing from c to cc ended above point bb and was shorter than both preceeding downswings. Then the fourth downswing from d to dd was even shorter and established a second consecutive higher low after the pretty severe break ending at bb. A reasonable inference at this point was that a turn was at hand if the market could move upward from point dd.
In fact the next upswing from dd to e was longer in points and in time that the one from cc to d. This makes me think that this the move up from from cc is not yet over and that when it is complete the whole swing upward from cc will be longer in time and price than the one from bb to c.
If this deduction proves correct then it would be reasonable to guess that the upswing from bb which so far has reached e will soon exceed in price and in time the upswing from aa to b. This in turn would be convincing evidence that new bull market highs lie dead ahead.
No comments:
Post a Comment