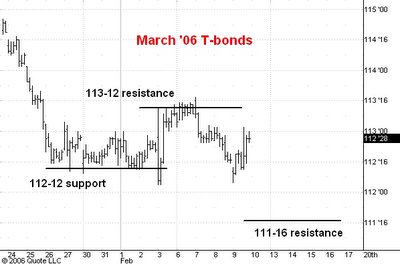
Here is an hourly chart of pit trading in the March T-bond futures.
The market has been stuck between support at 112-12 and resistance at 113-12 for a couple of weeks now. I think the market is about to make a lower top in the 113-08 to 113-12 range and then head down to 111-16. Over the next few months I am expecting a move down which will cary the bonds into the 107-108 zone.
No comments:
Post a Comment