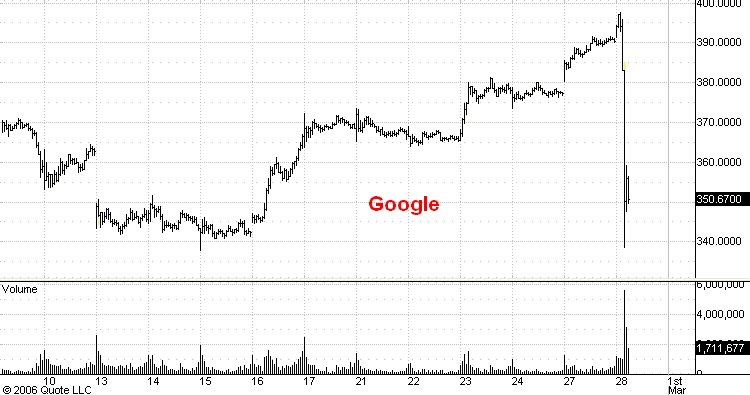
Here is a 15 minute chart of Google showing its activity after the 337 low following the Barron's article two weeks ago. This morning Google's CFO tried to deflate expectations of an ever growing (!!!!) growth rate by observing that as GOOG grew its growth rate was declining. Typical of every business I've ever seen.
But as you can see on the chart traders shoot first and ask questions later. In less that half an hour GOOG dropped almost 60 points, all the way back to 338. It is too early to tell from market activity whether 337 will hold or not. My own guess is that it will hold or be broken by only a couple of points. My reason is that the 337 level is just a little below very strong support at 347 and is itself strong support for other reasons. Plus this break occurred on very high volume but didn't drop below 337 (so far). This gives it the appearance of climatic selling on news which typically occurs near the end of a trend rather than near its beginning.
No comments:
Post a Comment