Friday, September 30, 2005

Crude Oil


Here is an hourly chart of pit and electronic trading in November crude oil.

I think the market is now headed for 60.60 and eventually to 55.50 over the next couple of months.

Gold


Here is an updated hourly chart of pit and electronic trading in December gold.

Right now support is at the bottom of the current box near 470 and I think gold will soon be in the 486-490 range before any substantial reaction starts.

S&P


Here is an updated hourly chart of pit trading in the December S&P.

I have drawn in blue the 17.40 point short term price boxes which will probably control the move up from the recent 1211 low. Note that the top of the current blue box nearly coincides witht the 1/2 division point of the current red box. These red boxes are controlling the up move from the April pit low at 1136.80 and are 43.70 points high.

I think that the market will shortly reach the 1246 level and after a brief period of hesitation move into the 1268-1271 zone which marks the top of the current red box and the 1/2 division point of the second blue box above the current one.

Guesstimates on September 30, 8:40 am ET

December S&P Futures: The next short term upside target is 1268 and support today is at 1224.

December Bonds: I think a big move upward into the 121-123 range has begun. Support is at 114-12.

December 10 Year Notes: I think the move up to 116 has started. Support is at the 110-02 level.

December Eurocurrency: The next swing should be upward to 126.50.

November Crude: I think prices will move downward from here. The next short term downside target is 60.60. We should see the 55.50 level in a few weeks.

December Gold: Headed for short term resistance at 488.

Google: 300 is support; upside target is 343.

Thursday, September 29, 2005


Daily Chart of NYSE Advancing Issues

Hourly Chart of December S&P Futures

S&P

Here is an updated hourly chart of the December S&P futures. I think the market is in the process of accelerating above the top of the box at 1224 and in a week or so it should rally to the top of the next box at 1268.

There is some supporting evidence to be found in the daily count of the number of advancing issues on the New York Stock Exchange. This is the second chart above this post. Note the upward zig-zag in the black line which records the daily numbers. Note also that the 10 day moving average (red line) has turned upward from a level that was even lower than that recorded when the market was on its way down to 1135 this past spring. These three advancing issues observations are harbringers of rising prices.

Daily Chart of IBM Posted by Picasa

IBM

Here is a daily chart of IBM .

IBM has reacted more than I expected from its top around the 85 level. As you can see it bounced off the bottom of its current box around 77 a few days ago. I think IBM is now on the way into the 88-90 zone. I expect to see 108 before the bull market ends.

Rydex Cash Flows

Below this post you will find updated charts of the Rydex Cash Flow ratio and the flow of cash into Rydex bear funds courtesy of Decisionpoint.com.

The cash flow ratio has exceeded the level it reached at the Katrina low which was 1199 electronic for the December S&P futures contract. This shows a higher level of bearishness at 1222 today than at 1199 a month ago. Notice too that the cash flow into bear funds is at a record high.

Both charts tell me that a significant drop from current levels is highly unlikely.

Rydex Cash Flow into Bear Funds Posted by Picasa

Rydex Cash Flow Ratio on September 28 Posted by Picasa

Guesstimates on September 29, 8:45 am ET

December S&P Futures: The next short term upside target is 1268 and support today is again at 1219.

December Bonds: I think a big move upward into the 121-123 range has begun. Support is at 114-12.

December 10 Year Notes: I think the move up to 116 has started. Support is at the 110-02 level.

December Eurocurrency: The next swing should be upward to 126.50.

November Crude: The market broke past the 66.30 resistance level yesterday but yesterday’s high at 67.40 was at the ½ point of the box so I think prices will move downward from there. The next short term downside target is 60.60. We should see the 55.50 level in a few weeks.

December Gold: It looks like the low for the reaction in gold has occurred and the next step up will carry the market to 488.

Google: 300 is support; upside target is 343.

Wednesday, September 28, 2005

Crude Oil


The rally from the 63.00 level will end at or below resistance at 66.30, the top of the current box.

Next short term downside target is at 60.60.

Gold


Here is an updated hourly chart of pit and electronic trading in December gold.

I had been thinking that the market would hit 460 before starting its next upleg, but now it looks like the low at 461.20 ended the reaction from 479.

The next upside target is the 488 level, near the 1/2 point of the next box at 490.

Google


Here is an updated daily chart of Google.

Unlike Baidu.com, GOOG is acting much better than the general market. I think this bounce off of the top of its box will hold support near 300 and that GOOG will soon see the 343 level. I still expect GOOG to reach 376 over the next few months.

Baidu


Here is an updated daily chart of Baidu.com

Ever since Goldman Sachs started coverage of BIDU on September 13 the stock has acted much worse than Google and much worse than the averages. This is an indication that the post IPO high at 153 is probably the bull market high for BIDU, contrary to what I had thought previously.

Even so, BIDU has dropped only a bit past the bottom of its trading box at71 and onl;y a little more past the support level at 1/2 the all time high of 153. I think BIDU will rally from here at least to 108 and quite possibly higher than that.

Guesstimates on September 28, 8:55 am ET

December S&P Futures: The next short term upside target is 1268 and support today is at 1219.

December Bonds: I think a big move upward into the 121-123 range has begun. Support is at 114-12.

December 10 Year Notes: I think the move up to 116 has started. Support is at the 110-02 level.

December Eurocurrency: The next swing should be upward to 126.50.  

November Crude: The 66.30 level is resistance today and the next short term downside target is 60.60. We should see the 55.50 level in a few weeks.

December Gold: It looks like the low for the reaction in gold has occurred and the next step up will carry the market to 488.

Google: 300 is support; upside target is 343.  

Tuesday, September 27, 2005

Bonds and Notes


Here are updated hourly charts of the December t-bond and 10 year note futures.

I think both markets are establishing lows at the 1/2 point of their current boxes and will move higher from here.

Stock Market Bears

I think an accurate assesment of investor and trader sentiment is a key element in constructing forecasts for any market. As you know I prefer to make these judgements by reading and watching the national print and broadcast media. I think these outfits are in the business of telling people what they want to hear and so they are a good guide to the public's current fears and hopes.

Even so, it is useful to check conclusions drawn in this way against more objective measurements if they are available and reliable.

As you know I think current stock market sentiment in the USA is remarkable bearish considering that the averages are so close to their bull market highs and considering that the unweighted averages are at historical highs.

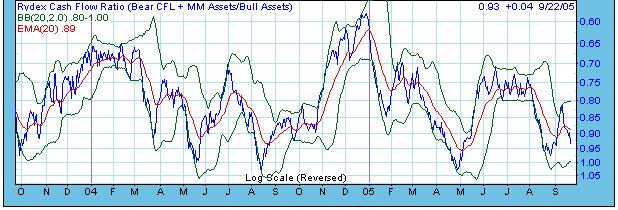
A few days ago I showed you a chart of the Rydex cash flow ratio (courtesy of 
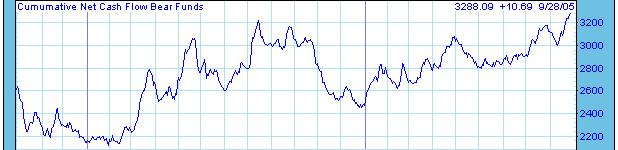
Decsionpoint.com). The blue line shows the daily ratio and it has dropped past the 0.90 level that has been associated with market lows during the past 4 years. Another piece of information from Decisionpoint.com is the cash flow into Rydex bear funds which bet on declining stock prices. This cash flow has reached record highs and indicates an extreme level of bearishness.

You might also want to check out the sentiment readings from Lowrisk.com The latest reading is 64% bears, and equals the highest readings seen during the past 4 years.

Finally, I want to comment on one of the most interesting phenomena in contrary opinion analysis. Ever since the concept of contrary opinion was popularized by Humphrey Neill, stock market predictors have felt it necessary to justify their forecasts by asserting that "the majority" held an opinion opposite to their own, and thus that their forecasts represented a "contrary" view.

I've already shown you objective evidence that bearish sentiment is strong. Now check out the Crystal Ball Forum front page. You see there two sentiment readings. One is called current sentiment and shows the bears at 51%. Thus the majority of Crystal Ball members think the stock market is headed lower from here. But the most intersting number is called "current perception" and shows what these bearish forecasters think other people believe. Notice that the bearish forecasters at Crystal Ball think that 61% of everyone else is bullish. This is a classic case of justifying one's own bearishness by a bald assertion (unsupported by much evidence) that your's is the "contrary" opinion and that "everone else" is bearish.

Guesstimates on September 27, 8:50 am ET

December S&P Futures: The next short term upside target is 1268 and support today is at 1219.

December Bonds: I think a big move upward into the 121-123 range has begun. Support is at 114-12.

December 10 Year Notes: I think the move up to 116 has started. Support is at the 110-02 level.

December Eurocurrency: The market has reached support at 120.80 and the next swing should be upward to 126.50.  

November Crude: The 66.30 level is resistance today and the next short term downside target is 60.60. We should see the 55.50 level in a few weeks.

December Gold: I think gold will drop to 460 or so before the uptrend resumes.

Google: 300 is support; upside target is 343.  

Monday, September 26, 2005

S&P


Here is an updated hourly chart of pit trading in the December S&P futures. I think the market is about to accelerate above the top of its box at 1224 and head up to the top of the next box near 1268.

Gold


December gold bounced off of the 1/2 point of its current box but I'm guessing that the rally will stop near 473. Then the market will probably drop a bit below 460 before turning higher once more.

Eurocurrency


Here is an updated hourly chart of the December eurocurrency futures. The market has reached support at 120.70, near the 1/2 point of its current box. I think the next move from here will be upward to 126.50.

Crude Oil


The November futures have rallied past what I thought would be resistance around the 64.70 level in this morning's guesstimate. I now think that the top of the current box near 66.40 will halt the rally.

Guesstimates on September 26, 8:50 am ET

December S&P Futures: The next short term upside target is 1268 and support today is at 1219.

December Bonds: I think a big move upward into the 121-123 range has begun. Support at 115-04 failed this morning but the market should hold the 114-12 level..

December 10 Year Notes: I think the move up to 116 has started. Support at 110-20 failed this morning but the market should hold the 109-28 level.

December Eurocurrency: The market has reached support at 120.80 and the next swing should be upward to 126.50.  

November Crude: The 64.70 level is resistance today and the next short term downside target is 60.60. We should see the 55.50 level in a few weeks.

December Gold: I think gold will drop to 460 or so before the uptrend resumes.

Google: 300 is support; upside target is 343.  

Friday, September 23, 2005

S&P


Here is an updated hourly chart of pit trading in the December S&P futures.

The market bounced of the bottom of the box (blue line) defined by the first reaction in the drop from the 1250 level. It has rallied to the top of its current box at 1224 (red line) which is part of the sequence of boxes which starts from the 1136.80 pit low this past April.

I think the market is about to break decisively above the 1224 level and if it does the way will be clear for a rally to the top of the next "red" box at 1268.

Crude Oil


Here is an updated hourly chart of pit and electronic trading in November crude oil.

I think the market is headed for the 60.80 level within a week or two and the 56.00 level within a month or two.

Eurocurrency


Here is an updated hourly chart of pit and electronic trading in the December eurocurrency.

The market is approaching the 1/2 point of its current box near 120.80. I think it will make a low their and rally to 126.50.

Bonds and Notes


I am very bullish on the bond and 10 year note futures. Here are updated hourly charts of pit trading in the December contracts.

The bonds have dropped to the bottom of a box at 115-04. The notes have dropped to the 110-20 support level I cited in this morning's guesstimate, just ahead of the bottom of their box at 110-16.

I think both market are about to turn upward. Over the next couple of months I think the bonds will rally into the 121-123 zone and the notes to 116. After that a bear market is likely to start.

Sears Holdings


I certainly got this one wrong. Contrary to my expectations SHLD has woefully underperformed the market ever since its July high of 163. This is not a good sign and to me it means that when the market averages make new bull market highs Sears Holdings will stay below 163.

Right now I see support at the bottom of the current box at 102, although I have other good reasons to think the market will hold the 107 level and not make it all the way to 102. The next rally will probably carry at best to 140 or so before SHLD heads down again.

Stock Market Sentiment Update


As you know I believe that there is way too much bearish sentiment about the stock market in the US to permit a substantial drop on prices.

Above this post you will see a chart of the Rydex Cash Flow ratio, courtesty of Decisionpoint.com. During the past four years, everytime the blue line dropped to 0.90 a substantial rally ensued. This is a reason for thinking the S&P will rally from here.

Along the same lines check out this column by Mark Hubert on Moneywatch.com. Hulbert finds the sentiment of market timers currentyly very bearsh, especially on the Nasdaq.

Guesstimates on September 23, 8:45 am ET

December S&P Futures: I expect the bottom of the trading box at 1211,  described in Wednesday’s late afternoon post, to hold.  The next short term upside target is 1268.

December Bonds: I think a big move upward into the 121-123 range has begun. Support is at 115-04.

December 10 Year Notes: I think the move up to 116 has started. Support is at 110-20.

December Eurocurrency: The market should reach support at 120.80 soon.  Then expect a rally to 126.50.

November Crude: The 68.30 level should halt the move up from 63.20. We should see the 55.50 level in a few weeks.

December Gold: I think gold will drop to 460 or so before the uptrend resumes.

Google: 300 is support; upside target is 343.  

Thursday, September 22, 2005

S&P Bull Market Boxes


Here is a daily chart of the cash S&P 500. I've drawn the 187 point boxes that have so far controlled the bull market advance from the 768 low in October 2002.

As you can see the market has bounced off the 1/2 point of the current box three times in the past six months, a very unusual event. Nonetheless, I expect the market to rally at least to the top of the current box near 1325 by the end of the year.

Gold


Here is an updated hourly chart of December gold showing pit and electronic trading.

As you can see the market has dropped about 12 dollars from its overnight high at 479. I think it will rally now to 472-473 and then drop to a level a couple of dollars above the bottom of the box at 456. Then it should rally to 490.

Guesstimates on September 22, 8:45 am ET

December S&P Futures: My best guess now is that the bottom of the trading box at 1211,  described in yesterday afternoon’s late post, will hold.  There is an outside chance of continuation down to 1202. In either case the next short term upside target is 1268.

December Bonds: I think a big move upward into the 121-123 range has begun.

December 10 Year Notes: I think the move up to 116 has started.  

December Eurocurrency: The rally should stall a previous support near 122.70 and then I think the market will drop to 120.80.  A decisive move above 123.00 will convince me instead  that the rally to 126.50 is underway.

November Crude: The 68.30 level should halt the move up from 63.20. We should see the 55.50 level in a few weeks.

December Gold: The market is spending time above the top of its box near 469 but I still think a reaction of at least 10 to 12 dollars is likely before the up move resumes.

Google: 290 is support; upside target is 343.  

Wednesday, September 21, 2005

Another Thought on the S&P


After I wrote the last post I realized that there is in fact a well defined downtrend box nearly 20 points wide in the December S&P. This box is delimited by the blue lines on the chart above and the bottom of the second box in the downtrend is at 1211.

I think the market will make a low above the Katrina low (1194 electronic and 1202 pit) so I am leaning towards the view that the low will occur at 1211 rather than 1202 for this reason.

S&P Update


This morning I thought that the December S&P futures would hold support near 1224, the bottom of a box. This didn't happen so I have to conclude that the market is headed down to the 1/2 point of the current box near 1202.

Three Peaks and Domed House Update


For nearly two years I have been following the development of an example of George Lindsay's Three Peaks and a Domed House formation in the Dow and in the S&P 500.

The first chart you see above is a schematic showing the ideal pattern with the associated numbering of the sequence of highs and lows.

The second chart is a weekly chart of the Dow Industrials. I have put two sets of labels on this chart. Both the red labels and the black labels are possible interpretations of the Dow's action since January 2004 in terms of a three peaks and domed house.

We are now in a situation where both interpretations have converged; in other words, they both tell me that the market is now at point 20 of the domed house. Therefore, according to either interpretation, the next swing should be a fast rally upward to the top of the domed house, point 23.

As to timing, the "red" interpretation has the advantage of giving us a well defined and obvious point 14: May 13, 2005. This is Lindsay's preferred starting point for his time measurement of 7 months 10 days which then predicts point 23 for December 23, 2005. At the moment this is my best guess for the timing of the bull market top which would end the advance from the 2002 low.

Crude Oil


Here is an updated hourly chart of November crude oil. In this morning's guesstimate I said that the 68.30 level would act as resistance. As you can see the market reached a high of 68.27 and has since dropped.

I find myself wondering how many times crude oil and gasoline futures will discount storm damage. I think the market has set itself up for a big break once Rita is history. The 55.00 level is my downside target for the next couple of months.

S&P


Here is an updated hourly chart of the December S&P futures. I think the bottom of the box at 1224 will act as support. I also think we have seen the day's low already at 1220.20 and that the market will close the day above 1224. The next swing will be upward to 1268.

Guesstimates on September 21, 8:55 am ET

December S&P Futures: I think the market will hold support now at the bottom of the box at 1224. The next short term target is 1268.

December Bonds: I think the next big move will be upward into the 121-123 range has begun.

December 10 Year Notes: I think the move up to 116 has started.  

December Eurocurrency: The rally should stall a previous support near 122.70 and then I think the market will drop to 120.80.  A decisive move above 123.00 will convince me instead  that the rally to 126.50 is underway.

November Crude: The market broke past 67.30 resistance early this morning but the 68.30 level should halt the move up from 63.20. We should see the 55.50 level in a few weeks.

December Gold: The market is spending time above the top of its box near 469 but I still think a reaction of at least 10 to 12 dollars is likely before the up move resumes.

Google: 290 is support; upside target is 343.  

Tuesday, September 20, 2005

Greenspan Tests the Bond Market


I thought the Fed would pause in its policy of interest rate hikes. I was wrong and instead the Fed raised the funds rate 25 basis points.

This was exactly what the market was expecting. Moreover, the naive expectation after such a move would be that bond prices would fall and that interest rates would rise across the board.

So the Fed's action gives us a chance to see just how strong or weak the underlying condition of the market is. Greenspan is testing the bond market.

The hourly chart above is an updated picture of the pit trading in the December t-bond futures. The spike downward actually occurred before the Fed announcement. Since then the bonds have rallied sharply and have traded above yesterday's high. I think this action has bullish implications and strengthens my view that the market is headed up big from here. The bond market bulls have passed Greenspan's test!

What Will Greenspan Do?

Here is my best guess.

I think the Fed chairman is above all a politician. And politicians are inclined to be careful when there is a lot of uncertainty about the consequences of possible actions. Morever, good politicians take care to avoid blame for bad outcomes.

With this in mind I predict that the Fed will leave interest rates unchanged today. Why? There is a lot of uncertainty now about the Katrina and Rita effects on the economy. Oil prices have remained high and the last consumer confidence number was very weak. The last thing Greenspan wants is for the Fed to be blamed for a recession. And an interest rate increase in the face of these uncertainties will certainly earn such blame if indeed the economy slides into recession.

So a cautious politician would adopt a " wait and see " attitude at this juncture. This is exactly what I expect Greenspan to do today.

Gold


Here is an updated hourly chart of pit and electronic trading in December gold. As you can see the market exceeded the top of the box near 469 and nearly reached the 1/2 point of the next box. I do think we will see a reaction here. My best guess is that the market will drop either to 463 or to 455. In either case I expect the next leg up to carry to the top of the next box near 482.

Guesstimates on September 20, 8:50 am ET

S&P Futures: Support is still 1235 and the next short term target is 1268.

December Bonds: I think the next big move will be upward into the 121-123 range and that the August 8 low at 113-11 will not be broken in the meantime.  Support today is again at Friday’s low of 114-14.

December 10 Year Notes: I think the August 8 low at 109-02 will not be broken before the market moves up to 116.  Support today is again at Friday’s low of 110-16.

December Eurocurrency: The German election knocked the market through 122.70 support and I think it is now headed a full box lower to 120.80.  I still think that the market will move up at least to 126.50 before the bear market resumes.

November Crude: I think the market has made a top near 67.30 resistance and will now move below 62.50. We should see the 55.50 level in a few weeks.

December Gold: Resistance near 468 is pretty strong and I expect a reaction from here. The 455 level is support.  I think the bull market in gold has much further to go.

Google: 290 is support; upside target is 343.  

Monday, September 19, 2005

S&P


Here is an updated hourly chart of the December S&P futures. The market has reacted to just shy of the 1235 support level and I think it will rally the rest of the day today. Next short term target is 1268.

Crude Oil


In this morning's guesstimate I said that November crude oil would rally a box from its low to the 65.30 level. The updated hourly chart above shows that the market's rally has been even stronger than I anticpated, carrying prices beyond the top of the recent trading range. I think the rally will carry the market up no more than two boxes and stop shy of the 1/2 point of the current box at 67.30.

Guesstimates on September 19, 8:45 am ET

S&P Futures: The market is on its way to the next short term target at 1268.

December Bonds: I think the next big move will be upward into the 121-123 range and that the August 8 low at 113-11 will not be broken in the meantime.  Support today is at Friday’s low of 114-14.

December 10 Year Notes: I think the August 8 low at 109-02 will not be broken before the market moves up to 116.  Support today is at Friday’s low of 110-16.

December Eurocurrency: The German election knocked the market through 122.70 support and I think it is now headed a full box lower to 120.80.  I still think that the market will move up at least to 126.50 before the bear market resumes.

November Crude: I think the market will rally a full box from Friday’s low to 65.30 or so before the down trend resumes. We should see the 55.50 level in a few weeks.

December Gold: The market has reached 468 resistance.  The 455 level is now support and I think the bull market in gold has much further to go.

Google: 290 is support; upside target is 343.  

Friday, September 16, 2005

S&P


Here is an updated hourly chart of pit trading in the December S&P futures.

Yesterday afternoon I thought that support at 1235 (blue line) had been broken. But overnight the market recovered smartly back above that level so in this morning's guesstimate I said that yesterday's low was the end of the reaction and that the market was headed up to 1268, the top of the current box.

Notice that in pit trading this morning the market initially reacted back to the 1235 support level and then turned higher. This reinforces my belief that the break below 1235 was a head fake and that the bulls are now back in control.

Baidu Boxes


Here is an updated hourly chart of Baidu.

You can see that the market has nearly reached support at 1/2 the all time high and is not far from the bottom of its current box. I think the market will soon start to trade sideways above those levels and that the next big move will be upward.

Gold


Here is an updated hourly chart of pit and electronic trading in December gold futures. As you can see the market continues its march to the top of the current box near 469. I think this bull market will eventually carry above 500.

Eurocurrency


Here is an updated hourly chart of pit and electronic trading in the December eurocurrency futures. I think we have a "dog that didn't bark" situation here. The bond and note futures tanked today but the eurocurrency held steady as a rock. Normally when US interest rates go up one expects the eurocurrency to break in sympathy. The fact that it held steady is a bullish indication.

This is evidence that the eurocurrency is now headed back to 126.50. My guess is that such a move would accompany a rally in the bonds and notes.

Crude Oil


Trading in crude oil futures has shifted into the November contract so I thought I would put up an hourly chart of pit and electronic trading in November crude oil.

As is my custom I drew the price boxes at exactly the same levels they were in the October contract.

I think the short and intermediate term trends (as well as the long term trend) are down in crude oil. Short term I expect to see 60.50 in a week or two. The intermediate term downside target is 55.50.

Bond and Note Update


Here are updated hourly charts for the December t-bond and 10 year note futures.

I have completely misjudged the extent of the reaction from the post-Katrina highs in these two markets. However, I remain convinced that the level of bearishness at the August 8 lows together with the strength of the support at those lows will generate a move above the early June highs ( 119-23 in the bonds and 114-21 in the notes ).

Moreover, I think that the August lows of 113-24 in the bonds and 109-27 in the notes will hold.
Both these markets have dropped to box levels just above the ones which supported the August 8 lows as you can see on the charts above. I think both will turn up from here.

Bearish on Baidu ( What's New? )

Here is the latest column by John Shinal posted on MarketWatch. Mr Shinal seems to have a lot of confidence in the forecasts made by investment banks, at least if they are bearish ones about Baidu.com.

I think BIDU will hold above 78 and then move much higher.

Guesstimates on September 16, 8:55 am ET

S&P Futures: Yesterday afternoon I thought that 1235 support had been broken but in overnight trading the market moved back above 1235 and stayed there. Since I am very bullish I have to conclude that yesterday’s low at 1230.70 (December futures) will hold and that a move up to 1268 has started.

December Bonds: The bonds have traded a little below the low of their box at 115-04 but 114-24 is the worst I expect to see on the downside before a move up over 119 begins. The 121-123 zone is my target for the next couple of months.

December 10 Year Notes: The notes have traded a bit below the ½ point of their box at 110-30 but 110-24 is the worst I think we’ll see on the downside before a move up over 113 begins. The 116 level will be reached during the next couple of months.

Eurocurrency: I think the December contract will hold support at 122.75, the ½ point of its current box.. The next big swing will be upward to 126.50.

October Crude: Resistance is still 65.40 and the market is now on its way to 60.50. We should see the 55.50 level in a few weeks.

December Gold: The market is on its way to 468 and eventually much higher than that.

Google: 290 is support; upside target is 343.

Thursday, September 15, 2005

Google


Here is an updated hourly chart of Google.

I think GOOG is headed for the 1/2 point of its current box near 292 and will then rally to 343.

S&P


I thought that 1235 would be support in the December futures today. But as the hourly chart above this post shows, the market has traded below that level for most of the day. I conclude that lower prices are ahead and that a drop to the bottom of the current box near 1224 is underway.

Once the market reaches the bottom of the current box I expect it to rally to 1268.

Crude Oil


Here is an hourly chart of pit and electronic trading in October crude oil futures. I think the market has stopped at resistance at the 1/2 point of the box near 65.40 and is now headed down to 61.50. Over the next few months I expect to see crude trade at 56.00.