September S&P Futures: The next upside target for the S&P’s is 1296. Meantime support is at 1273.
September Bonds: Resistance is at 108-20 and support at 107-24. The market is in the midst of a bigger rally to 110.
September 10 Year Notes: Resistance is at 106-04 and support at 105-18. The notes are headed for 107.
Euro-US Dollar: I still think 127.80 is resistance and that the market will soon begin a drop to below 123.00.
Dollar-Yen: The yen didn’t hold 115.00 but I do think that 114.30 will be support today. The next development will be a rally to 120.00. The yen should reach 130 over the next year.
September Crude: Downside target is 68.00 and resistance above the market is at 75.90.
August Gold: Short term downside target is 580. Resistance above the market is at 639. A drop below 500 is underway.
September Silver: I think silver is on its way below 900. Short term downside target is 980. Resistance above the market is still at 1150.
Google: Support is at 372 and I think GOOG will soon move above its last high at 455.
Monday, July 31, 2006
Friday, July 28, 2006
S&P
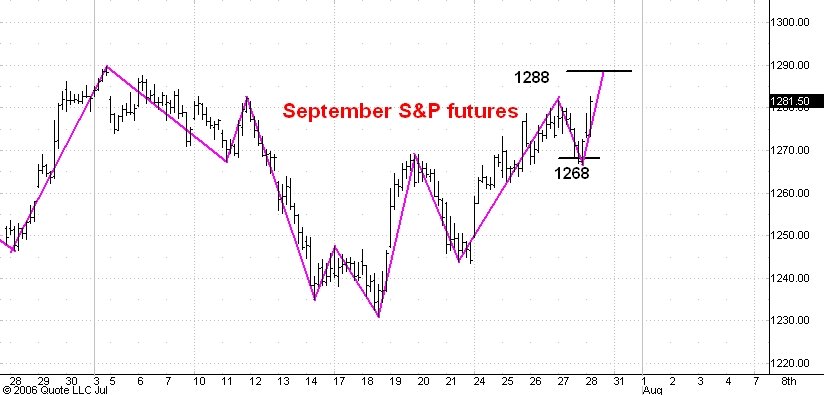
Here is an hourly chart of the September S&P e-mini futures. I last commented on this chart yesterday.
The market bounced off of support at 1268 and in this morning's guesstimate I said that I thought the bounce was the second phase rally and would stop around 1276. But the market is proving even stronger than I have expected and a short while ago broke above yesterday's high at 1281.75. I now think this upmove will continue to 1288 or so (the July 7 high was 1290 in electronic trading).
The main thing to keep in mind is that this upmove is only the initial stage of a move to 1350 and above which should develop over the next 3-4 months.
Guesstimates on July 28, 8:50 am ET
September S&P Futures: The S&P’s should bounce off of resistance today at 1276 and then drop to my 1262 target for a three phase correction. After the correction is over I expect the market to rally to 1300.
September Bonds: I am looking for a move to 108-20. The market is in the midst of a move to 110.
September 10 Year Notes: The development in the notes will be a move to 106-04 and then to 107.
Euro-US Dollar: I think 127.80 is resistance and that the market will soon begin a drop to below 123.00.
Dollar-Yen: The yen should hold 115.00 and then rally to 120.00. The yen should reach 130 over the next year.
September Crude: Downside target is 68.00 and resistance above the market is at 75.90.
August Gold: Short term downside target is 580. A drop below 500 has begun. Resistance above the market is at 639.
September Silver: I think silver is on its way below 900. Short term downside target is 980. Resistance above the market is still at 1150.
Google: Support is at 372 and I think GOOG will soon move above its last high at 455.
Thursday, July 27, 2006
S&P
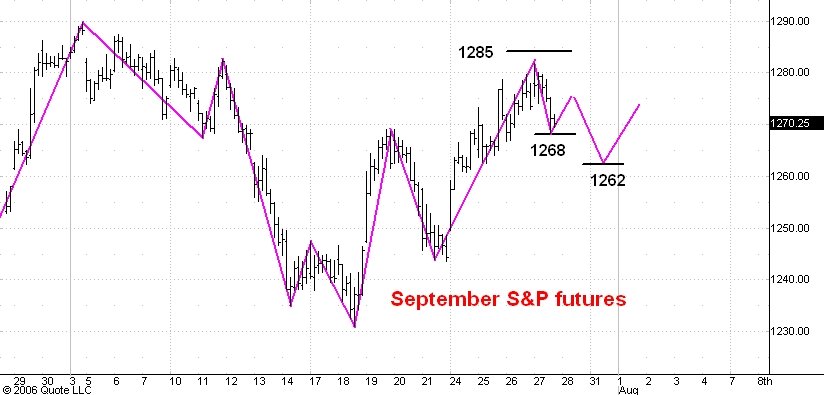
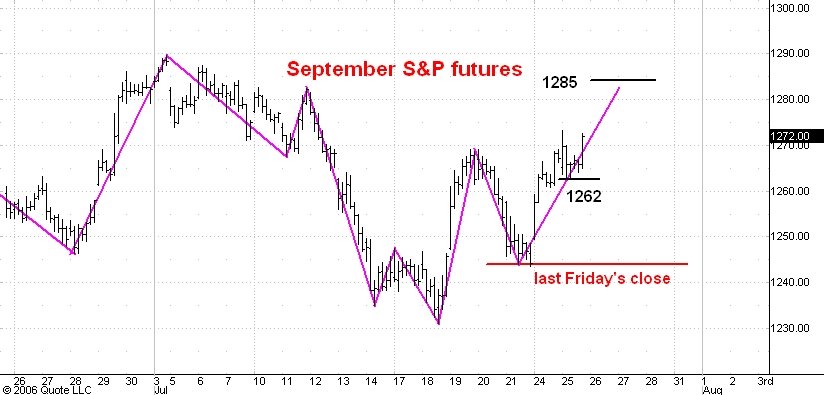
Here is an hourly chart of the September S&P e-mini futures. I last commented on this chart here.
The market traded as high as 1281.75 this morning, a little shy of my 1285 target. Right now I think a three phase reaction has started from that high. The first phase will probably end near 1268 and be followed by a second phase rally of 5 to 8 points. The third and final phase should then carry the market down near the 1262 level.
After this correction is complete I expect the market to rally to 1300 or higher.
USD \ Euro
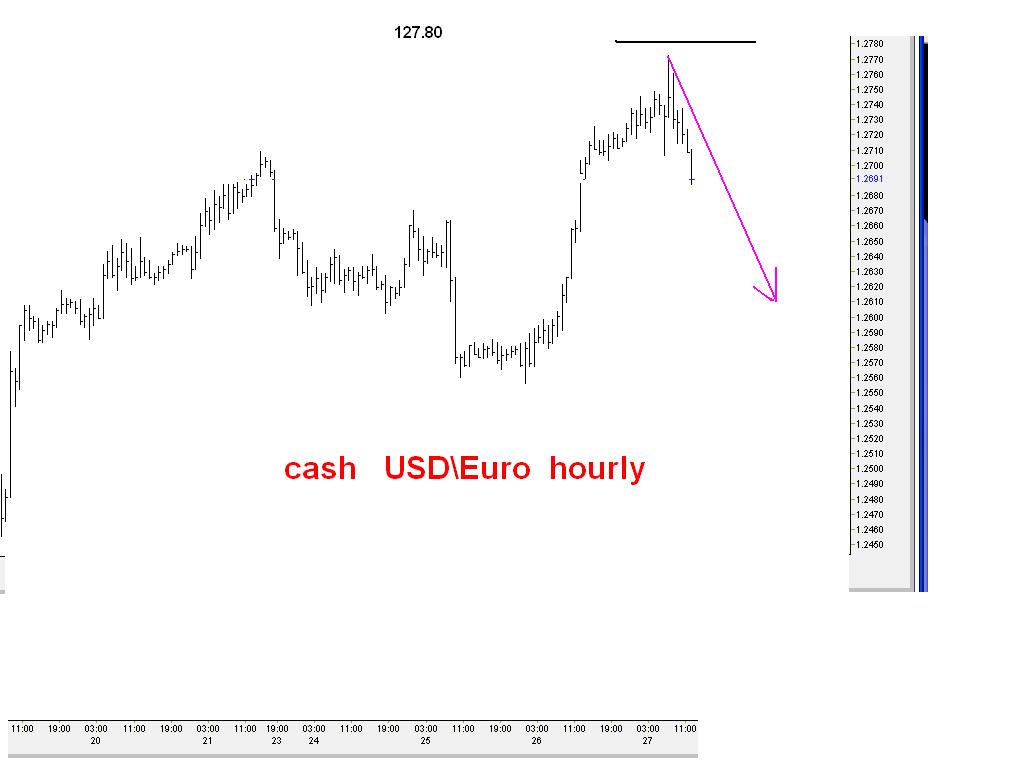
Here is an hourly chart of the cash USD\Euro pair.
Ever since the July 20 guesstimate I have been looking for the euro to rally to 127.80 in a three phase correction. This morning the market traded as high as 127.73 and I now believe that the rally from the 124.56 low of July 17 is over. The next development should be a drop below the 123.00 level.
Gold
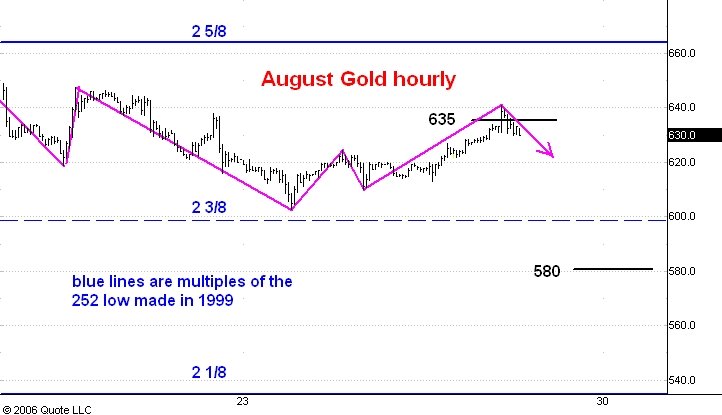
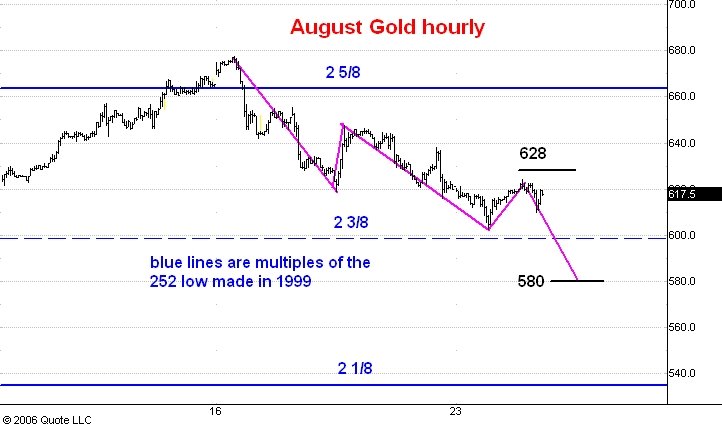
Here is an hourly chart showing pit and electronic trading in August gold futures. I last commented on this chart here.
I think we have just seen the completion of a three phase rally in gold that took the market just a little above what I thought would be resistance at 635 this morning. I now expect the market to drop to its next short term target at 580. This will be part of a more extended drop to below the 500 level.
Silver
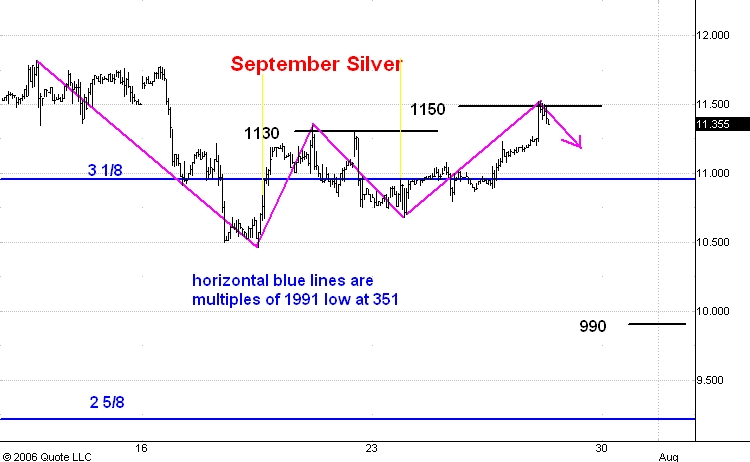
Here is an hourly chart showing pit and electronic trading in September silver futures. I last commented on this market here.
I thought silver would hold below its high of July 20 at 1135 but instead the market rallied to 1150 this morning. At the 1150 level I can identify a clear three phase rally. Since I also see some resistance near 1150 I think the marke will now begin a drop to 990. Over the next couple of months I expect to see silver trade below 900.
Guesstimates on July 27, 8:50 am ET
September S&P Futures: The S&P’s are headed for 1285. Meantime support is at 1268.
September Bonds: I don’t think the bonds will reach the 107-02 level an am now looking for a move to 108-20. The market is in the midst of a move to 110.
September 10 Year Notes: The development in the notes will be a move to 106-04 and then to 107.
Euro-US Dollar: This morning the euro traded as high as 127.49 and I still think it has a shot at 127.80. In any even the next big move from current levels will be downward below 123.
Dollar-Yen: The yen has reached my downside target at 115.50. The next development should be a move up to 120.00. The yen should reach 130 over the next year.
September Crude: Downside target is 68.00 and resistance above the market is at 75.90.
August Gold: Short term downside target is 580. A drop below 500 has begun. Resistance above the market is at 635.
September Silver: I think silver is on its way below 900. Short term downside target is 980. Resistance above the market is still at 1130.
Google: Support is at 372 and I think GOOG will soon move above its last high at 455.
Wednesday, July 26, 2006

S&P
Here is an hourly chart of the September S&P e-mini futures. I last commented on this chart yesterday.
The market is getting close to my initial upside target at 1285. The last high of consequence was 1290 reached in electronic trading on July 7. My guess is that the market will stall a bit shy of that high and then react for a day or two. But any reaction should hold support in the 1260-65 zone. Once the 1290 high is breeched I think we will see the market stall briefly again near 1300.
I think that the June 14 low at 1229 will prove to be the end of the drop from the May top at 1331 and that the rest of 2006 will see a significant rally in the major stock market averages.
Google and Fibonacci

Here is a daily chart of Google. I last commented on GOOG here.
I'm sure you have heard of the Fibonacci sequence and you may even use it in your own market analyses. I want to bring your attention to a remarkable manifestation of the Fibonacci sequence in GOOG.
As you know the Fibonacci sequence is a sequence of whole numbers that starts out with the numbers 0 , 1, 1, 2, 3, 5, 8, 13, 21, 34, 55, 89, 144, 233, 377, 610, .... and never stops. You can see that each number in the sequence is obtained by adding together the two numbers which preceed it in the seqence. Thus for example, 55 = 34 + 21.
Now take a look at the Google chart. The low trade price for GOOG after its IPO in August 2004 was 95.96. If we add the Fobonacci number 377 to this low trade price we get 472.96. The all time high in GOOG so far has been 475.11. I find that conincidences like this should be watched to see if the Fibonacci numbers are beginning to influence the price pattern.
The thing to observe next is that the following two drops in GOOG were 144 and 90 versus the Fibonacci numbers 144 and 89. The last drop so far has been 50 points and on this basis I think it is reasonable to expect a low near 472 or a bit higher, thus making the third drop nearly 55 points in length.
My guess then is that the next leg up will be a big one and itself will be a Fibonacci number. The conservative candidate is 144 which when added to 372 gives an upside target of 516. A more intriquing possiblity is 233 which gives an upside target of 605. Note that 610 is itself a fibonacci number.
I think GOOG is nearing the end of its sideways movement that started this past January and will soon begin a move to new bull market highs.
Guesstimates on July 26, 8:50 am ET
September S&P Futures: The S&P’s are headed for 1285. Meantime support is at 1264.
September Bonds: I don’t think the bonds will reach the 107-02 level an am now looking for a move to 108-20. The market is in the midst of a move to 110.
September 10 Year Notes: The development in the notes will be a move to 106-04 and then to 107.
Euro-US Dollar: I think the euro is about to rally to 127.80 and then to drop below the 123 level.
Dollar-Yen: The yen should complete the third phase of its corrective move by dropping to 115.50. This will be followed by a resumption of the uptrend to the 130 level over the next year.
September Crude: Downside target is 68.00 and resistance above the market is at 75.90.
August Gold: Short term downside target is 580. A drop below 500 has begun. Resistance above the market is at 625.
September Silver: I think silver is on its way below 900. Short term downside target is 980. Resistance above the market is still at 1130.
Google: Support is at 375 and I think GOOG will soon move above its last high at 455.
Tuesday, July 25, 2006
S&P
Here is an hourly chart of the September S&P e-minis. I last commented on this chart here.
I think the market is about to take its next step upwards, this time to 1285 or so. Support in the mean time stands at 1262. I also believe that we shall see the S&P at 1350 before the year is out.
I think the market is about to take its next step upwards, this time to 1285 or so. Support in the mean time stands at 1262. I also believe that we shall see the S&P at 1350 before the year is out.

Silver
Here is an hourly chart showing pit and electronic trading in September silver futures. I last commented on this market here.
I think silver is on its way below the 900 level. Meantime short term resistance is at 1130. The next step downward should carry the market to 990.
I think silver is on its way below the 900 level. Meantime short term resistance is at 1130. The next step downward should carry the market to 990.
Gold
Here is an hourly chart showing pit and electronic trading in August gold futures. I last commented on this market here.
I think gold is heade below 500 over the next few months. In the meantime I see short term resistance near 628. From there the market will probably drop to short term support around 580.
I think gold is heade below 500 over the next few months. In the meantime I see short term resistance near 628. From there the market will probably drop to short term support around 580.
Guesstimates on July 25, 8:50 am ET
September S&P Futures: The S&P’s are headed for 1285. Meantime support is at 1255.
September Bonds: The bonds are headed for support at 107-02. After that the next upside target will be 108-20. The market is in the midst of a move to 110.
September 10 Year Notes: The notes should drop to support near 105-04 and then rally to 106-08 and then to 107.
Euro-US Dollar: I now think the second (downward) phase of the move to 127.80 will break below 126.10 support and stop instead at 125.60. The third phase should then carry the market upward to 127.80. Over the next few weeks I am looking for the market to drop to 123.00 and eventually much lower than that.
Dollar-Yen: The yen should complete the second phase of a three phase correction by holding below 117.10. The third phase will then be a drop to 115.50 which will be followed by a resumption of the uptrend to the 130 level over the next year.
September Crude: Downside target is 68.00 and resistance above the market is at 75.90.
August Gold: Short term downside target is 580. A drop below 500 has begun. Resistance above the market is at 625.
September Silver: I think silver is on its way below 900. Short term downside target is 980. Resistance above the market is still at 1130.
Google: Support is at 377 and I think GOOG will soon move above its last high at 455.
Monday, July 24, 2006
S&P

Here is an hourly chart of the September S&P e-mini futures. I last commented on this chart here.
I think a move to 1285 is underway. Support is at 1255 but if the market is as strong as I think I doubt that any reaction will actually reach that level. I have drawn a red line at the level of last week's close. As long as the market trades above there I shall remain confident that the trend is upward.
I also think that 1285 will only be a temporary stop on the road to 1350 which I think will be reached later this year.

Domed House Update
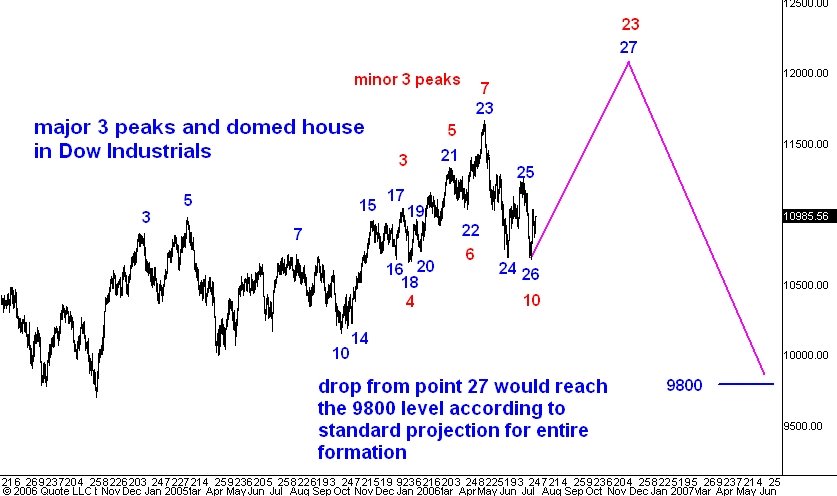
Here is a highly condensed daily chart of the Dow Jones Industrial average going back to June of 2004. On this chart I have updated my estimate of the market's current position within what I think are two ongoing examples of Lindsay's Three Peaks and a Domed House formation. I have also appended a schematic chart of the ideal three peaks and a domed house with the corresponding numbering.
As I explained in my last post on this subject I think the market has completed the domed house of the major formation (labeled with blue numerals). The domed house comprised points 21, 23, and 25. In this major formation (blue) you can see that the domed house is quite lopsided, leaning in the "bearish" direction. Another anomaly of this major formation is that the 7 month, 10 day time period from point 14 at best timed point 25, and that not very well.
The issue now is just how high will the Dow rally to establish point 27. As I explained in the last post one way to resolve this question is to observe that there is a minor three peaks visible on the same chart. This I have labeled with red numerals. The difference between a minor and major formation is this. In a major formation points 3 and 7 are separated by 6-10 months while in a minor formation they are separated by only 2-4 months.
I might add at this point that this is one reason why so many people misapply Lindsay's theory of this formation. If someone draws a three peaks for you in which points 3 and 7 are separated by more than 12 months you can be sure that you are not looking at a Lindsay Three Peaks and a Domed House formation.
In any case, the minor formation in red has completed its three peaks and its separating decline to red point 10. The next phase should be the domed house which almost always carries the market above the highest of the preceeding three peaks. Thus I expect red point 23 to coincide with blue point 27 and to occur at a new high for the bull market which began at the 7200 level in 2002.
As far as timing red point 23 (= blue point 27) I am inclined to expect the top 7 months and 10 days from red point 6. Thus I would project a top for late November 2006, probably close to the 12000 level in the Dow.
In any event, the forecast for the completion of the major (blue) formation is clear. According to Lindsay, the drop from point 27 should carry the Dow down to the start of this major formation. I estimate this to be the 9800 level in the Dow.
Guesstimates on July 24, 8:50 am ET
September S&P Futures: The S&P’s are headed for 1280. Meantime support is at 1244.
September Bonds: The bonds are headed for support at 107-02. After that the next upside target will be 108-20. The market is in the midst of a move to 110.
September 10 Year Notes: The notes should drop to support near 105-04 and then rally to 106-08 and then to 107.
Euro-US Dollar: The market should complete the second phase of a three phase rally by holding support at 126.10. The third phase should then carry it upward to 127.80. Over the next few weeks I am looking for the market to drop to 123.00 and eventually much lower than that.
Dollar-Yen: The yen should complete the second phase of a three phase correction by holding below 117.10. The third phase will then be a drop to 115.50 which will be followed by a resumption of the uptrend to the 130 level over the next year.
September Crude: Downside target is 68.00.
August Gold: Short term downside target is 580. A drop below 500 has begun.
September Silver: I think silver is on its way below 900. short term downside target is 980.
Google: Support is at 377 and I think GOOG will soon move above its last high at 455.
Friday, July 21, 2006
S&P

Here is an updated hourly chart of the September S&P e-mini futures. I last commented on this chart here.
In this morning's guesstimate I revised my estimate of support downward from 1258 to 1252. But as you can see the market has spent almost the entire day trading below 1252.
Even so, I am going to stick with my view that the market will move above 1270 before it drops below 1231. My intial upside target is now 1285. My reason's are as follows.
First, seven of the past eight trading days have been days on which there has been persistent selling pressure. Even so, the market has held above its 1229 low. Another application of the "dog that didn't bark" principle makes me think that the buyers during the past two weeks have more patience (and quite possibly more money) than the sellers, especially given the distressing news backround: turmoil in the middle east, terror bombings in India, oil at historical highs, etc.
Second, as I pointed out Wednesday, the 5 and 10 day moving averages of the daily advancing issues number have remained above their last two low points and this is a bullish divergence.
Third, the move up from the 1231 low on Tuesday does not yet have the classic three phase shape that most corrective moves have. This makes me think that the drop from 1269 is at worst only the middle phase of a move up from 1231 which is not yet complete.
Finally, the market remains above last Friday's close and has traded above that close for the better part of this week. This is one of my simple indicators of the trend direction and it is still favoring the bull side.
All in all I am led to expect a low, probably above last Friday's close at 1242 which will be followed at least by a rally to 1285. Moroever this rally may well prove to be the intial phase of a move to the 1350 level.
Guesstimates on July 21, 8:50 am ET
September S&P Futures: The S&P’s are headed for 1280. Meantime support is at 1252.
September Bonds: The bonds are headed for resistance at 108-20 and then for 110. Today support is at 107-02.
September 10 Year Notes: The notes should rally to 106-08 and then to 107.
Euro-US Dollar: It looks like the market is going to rally close to its last high of 128.59. My target for the moment is 127.80. The market is headed for 123.00 and eventually much lower than that.
Dollar-Yen: I now believe that the yen will not hold support at 116.20 but will instead drop to 115.50 before resuming its up trend. I still think the yen will reach the 130 level over the next year.
September Crude: Downside target is 68.00.
August Gold: Resistance above the market is at 650. Weakness below 620 will confirm that the big droop below 500 that I think is underway has indeed begun.
September Silver: I think silver is on its way below 900. Resistance above the market is at 1130.
Google: Support is at 386 and I think GOOG will soon move above its last high at 455.
Thursday, July 20, 2006
S&P

Here is an hourly chart of the September S&P e-mini futures. I last commented on this chart yesterday.
I think the market will react to support at 1258, perhaps dropping a bit lower to 1255. After this reaction I am expecting a move to 1280.
I strongly suspect that the June 14 low at 1229 will now hold. This is a reversal of my view earlier this week that the market will drop to 1219 before rallying above 1300. What changed my mind?
Well, one important consideration is the behavior of the daily advancing issues number. Another factor is the fact that the war news late last week couldn't drop the market below 1229. This is an example which illustrates the "dog that didn't bark" principle. Finally, I am finding that yesterday's rally is not getting any respect from those who comment on the technical aspects of market action. Admittedly this is a thin reed upon which to lean but I feel more comfortable holding a minority view of the significance of yesterday's rally.
Guesstimates on July 20, 8:50 am ET
September S&P Futures: The S&P’s are headed for 1280. Meantime support is at 1258.
September Bonds: The bonds are headed for resistance at 108-20 and then for 110. Today support is at 107-02.
September 10 Year Notes: The notes should rally to 106-08 and then to 107.
Euro-US Dollar: It looks like the market is going to rally close to its last high of 128.59. My target for the moment is 127.80. The market is headed for 123.00 and eventually much lower than that.
Dollar-Yen: The yen should find support at 116.20. I still think the yen will reach the 130 level over the next year.
September Crude: Downside target is 68.00.
August Gold: Resistance above the market is at 650. Yesterday gold reached short term support near 620. Weakness below there will confirm that the big droop below 500 that I think is underway has indeed begun.
September Silver: I think silver is on its way below 900. Resistance above the market is at 1130.
Google: Support is at 394 and I think GOOG will soon move above its last high at 455.
Wednesday, July 19, 2006
Advancing Issues
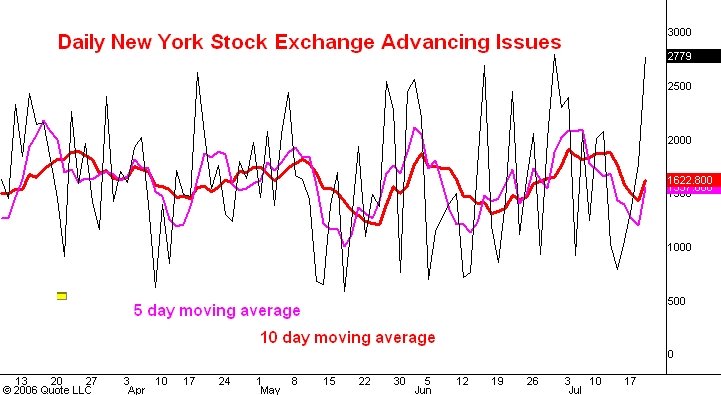
Here is a daily line chart of the number of issues traded on the New York Stock Exchange that advance in price. The pink and red lines are the five and 10 day moving averages of this number. I last commented on this indicator here.
Earlier today I said that I thought the September S&P futures were probably headed for the 1280 level. This chart of the advancing issues number reinforces that view.
The most significant thing I see in this chart is that both the 5 and the 10 day moving averages have made two consecutive higher lows, even as the S&P made a lower low and then a double bottom while the Nasdaq compostite has made lower lows. I regard this as a bullish divergence. In fact, it is making me suspect that the market won't stop at 1280. Indeed, a close above the 1285 level would convince me that a move to 1350 is underway.
Crude Oil
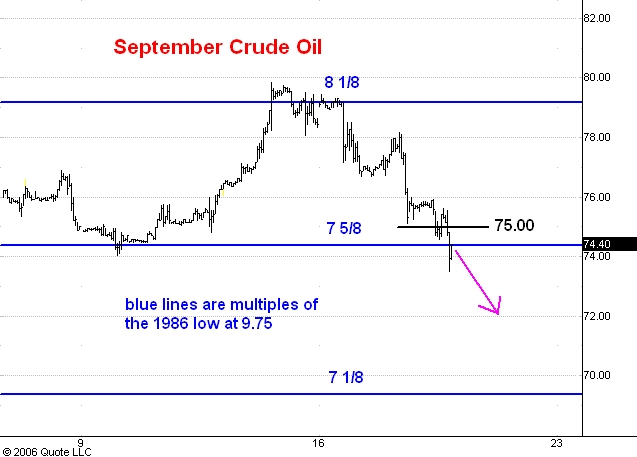
Here is an hourly chart showing pit and electronic trading in September crude oil futures. I am switching to this contract today from the August contract. September is trading about 1.80 over August. I last commented on crude oil here.
In this morning's guesstimate I said that weakness below the 75.00 in September crude oil would tell me that an extended drop has begun. As you can see the market has broken well below the 75.00 level today so I think it is headed for 69.50 which is roughly the 7 and 1/8 multiple of the 1986 low at 9.75
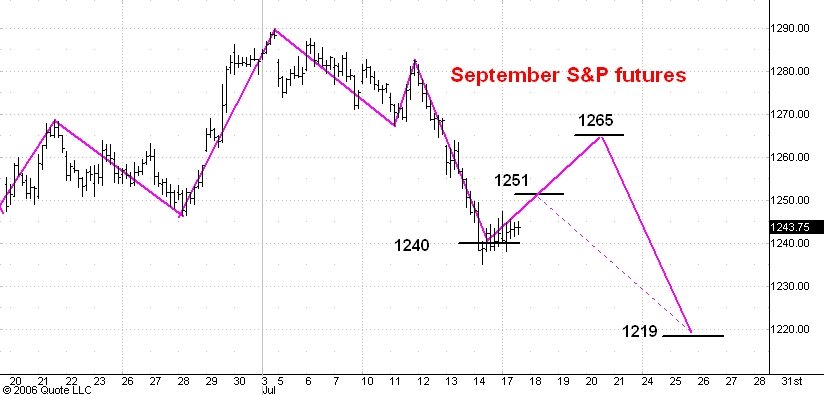
S&P

Here is an hourly chart showing regular hours trading in the September S&P e-mini futures. I last commented on this chart yesterday.
The market rallied above the 1257 target on Bernanke's testimony. I have changed my view a bit and now think it likely that the market will continue up to 1280 before making an attempt to break the June 14 low at 1229. If I am right about this then the 1250 support level should hold.
T-bonds

Here is an hourly chart showing regular hours trading in the September T-bond futures. I last commented on this market here.
This morning's CPI number pushed the market below what I thought would be 106-20 support but then Bernanke's testimony pushed it back above that level. I think the bonds are now headed for 108-20. This in turn is part of a rally into the 110-111 range. I also think that it is likely that we have seen the 2006 low in the bond market.
Guesstimates on July 19, 8:50 am ET
September S&P Futures: The S&P’s should rally at least to 1257 before dropping to the 1219 support level. Today support is at 1240.
September Bonds: The bonds dropped below 106-20 support today and it looks like the market will stop instead at 106-04. After that the market will head for the 110 level.
September 10 Year Notes: The notes have reached support near 104-20 and now I expect the market to head back up again.
Euro-US Dollar: The market is headed for 123.00 and eventually much lower than that.
Dollar-Yen: The yen has nearly reached the short term target at 118.00. Right now I think the market will probably reach the 118.50 level before we see a 100-200 pip break. I still think the yen will reach the 130 level over the next year.
September Crude: Switching to the September contract today which is trading about 1.80 over August. Support is at the 75.00 level and weakness below there will mean that a big drop has started.
August Gold: Gold has reached short term support near 620. Weakness below there will confirm that the big drop below 500 that I think is underway has indeed begun.
September Silver: I think silver is on its way below 900.
Google: Support is at 394 and I think GOOG will soon move above its last high at 455.
Tuesday, July 18, 2006
S&P

Here is an hourly chart of the September S&P e-mini futures. I last commented on this chart here.
In this morning's guesstimate I said that the 1232 level should be support today and as you can see the market made a low at 1231 this afternoon and has since rallied. I now think that the move up will continue to 1257 or so and will be followed by another break to the 1219 level. Strength above 1257 will mean that the move to 1350 which I am anticipating is underway.
US Dollar and the New York Times

Here is a daily chart of the US Dollar index. I last commented on this chart here.
As you can see the New York Times continues to be an invaluable aid in predicting the big trends in the US Dollar. I think the dollar index has begun a move that will take it to 96.00 or so. At the same time the yen should rally to 130 and I think the euro-dollar pair will drop below the 116 level.
Guesstimates on July 18, 8:50 am ET
September S&P Futures: The S&P’s should hold the 1232 level today and the next development will be a rally at least to 1251 but more probably into the 1260-70 range. After that rally the odds will then favor a drop to 1224.
September Bonds: Resistance is again at 107-26 today and from there I think the market will drop to106-20. After that the market will head for the 110 level.
September 10 Year Notes: Resistance today is at 105-20 and from there the notes should drop to support near 104-20. The market will then head for 107.
Euro-US Dollar: The market is headed for 123.00 and eventually much lower than that.
Dollar-Yen: The yen is headed for 118.00. I still think the yen will reach the 130 level over the next year.
August Crude: The market is headed for the 79.00-80.00 zone.
August Gold: Both gold and silver are struggling in the face of what should be bullish war news and this makes me think that a drop below 500 has started.
September Silver: Resistance is still at 1200 but the market made several attempts at that level on war news and couldn’t make it. I think the next big move from here will be downward.
Google: Support is at 394 and I think GOOG will soon move above its last high at 455.
Monday, July 17, 2006
S&P
Here is an hourly chart showing regular hours trading in the September S&P e-mini futures. I last commented on this market here.
I still think the S&P's will rally from here at least to 1251 and more probably into the 1260-70 range. At the moment I think this rally will be followed by a drop slightly below the June low of 1229. I have lowered my target slightly from 1224 to 1219.
I think the next 100 points in the S&P from current levels will be upward.
Gold
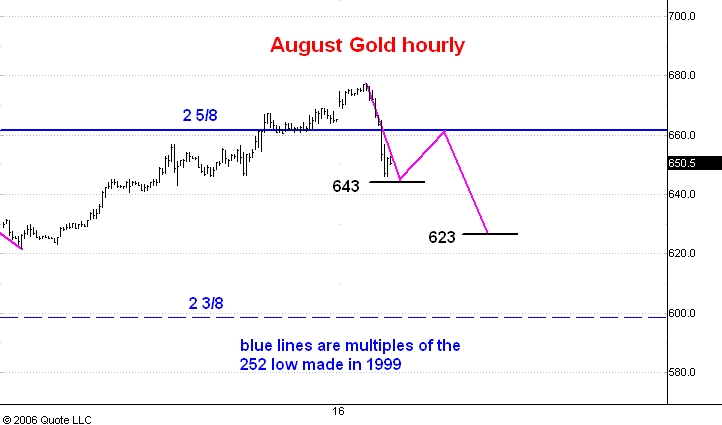
Here is an hourly chart showing pit and electronic trading in August gold futures. I last commented on this market here.
Over the past few days the war news from the middle east managed to push the market only marginally higher and today we have seen a big break in gold. The inability of the market to move higher on bullish news is a sign of serious weakness. This is the dog that didn't bark. All in all it looks like the market has stalled at the 662 resistance level and is preparing for a big move downward.
Over the next couple of days I think we will see a three stage drop to 623 or so. An real weakness below 623 will mean that a drop to below 500 has begun.
Guesstimates on July 17, 8:50 am ET
September S&P Futures: The S&P’s should hold the 1232 level today and the next development will be a rally at least to 1251 but more probably into the 1260-70 range. After that rally the odds will then favor a drop to 1224.
September Bonds: Resistance is again at 107-26 today and from there I think the market will drop to106-20. The market is headed for the 110 level.
September 10 Year Notes: Resistance today is at 105-20 and from there the notes should drop to support near 104-20. The market is headed for 107.
Euro-US Dollar: The market broke below 126.40 decisively this morning so I conclude that it is headed for 123.00 and eventually much lower than that.
Dollar-Yen: The yen is headed for 118.00. I still think the yen will reach the 130 level over the next year.
August Crude: The market is headed for the 79.00-80.00 zone.
August Gold: Gold reached 677 overnight, three dollars shy of the 680 target. Both gold and silver are struggling in the face of what should be bullish war news and this makes me think the next big move from here will be downward.
September Silver: Resistance is still at 1200 but the market made several attempts at that level on war news and couldn’t make it. I think the next big move from here will be downward.
Google: Support is at 394 and I think GOOG will soon move above its last high at 455.
Friday, July 14, 2006
S&P

Here is an hourly bar chart showing regular hours trading in the September S&P e-mini futures. I last commented on this market here.
This morning the market dropped 5 points below projected support at 1240 and I now think a rally has started. I think this rally will assume a classic, three phase shape. It should carry at least to 1251 at which level it will be 16 points in extent and equal to the size of two previous rallies within the drop from 1290. If the 1251 level is surpassed then the next stopping point would be 1265. A move as far as 1265 would open up the possibility that this morning's low will hold and that a move above the 1300 level has begun.
I would like to point out that the S&P futures have had a nearly 50 point range this week. The last time we saw this big a range was during the first week of October in 2005. The market dropped about 15 points lower the following week and then began a 150 point rally.
Over the years I have learned that unusually wide daily or weekly ranges typically occur on "breakout" moves. On the other hand, if a wide range day or week develops within a well defined trading range (as has this week's range) it typically signals trend exhaustion and an imminent reversal of day's or week's direction. This is what I am expecting to happen now in the S&P's. Moreover, I am still confident that we shall see the S&P at 1350 or higher later this year.
Guesstimates on July 14, 8:50 am ET
September S&P Futures: The S&P’s have nearly reached support at 1240 and the next development should be a rally into the 1260-70 range. After that rally the odds will then favor a drop to 1224.
September Bonds: Resistance is at 107-26 today and from there I think the market will drop to106-20. The market is headed for the 110 level.
September 10 Year Notes: Resistance today is at 105-20 and from there the notes should drop to support near 104-20. The market is headed for 107.
Euro-US Dollar: The market has nearly reached support at 126.40. Weakness below 126.40 would force me to abandon my 131.00 target and look for an extended drop instead.
Dollar-Yen: The yen is headed for 118.00. I still think the yen will reach the 130 level over the next year.
August Crude: The market is headed for the 79.00-80.00 zone.
August Gold: The 662 level is my target for the rally from 547. Silver has not reached its corresponding target so I think gold will continue up at least to 680.
September Silver: Resistance is at 1200. I am beginning to think that my 1270 target for the rally from 945 is too optimistic.
Google: Support is at 405 and I think GOOG will soon move above its last high at 455.
Thursday, July 13, 2006
S&P

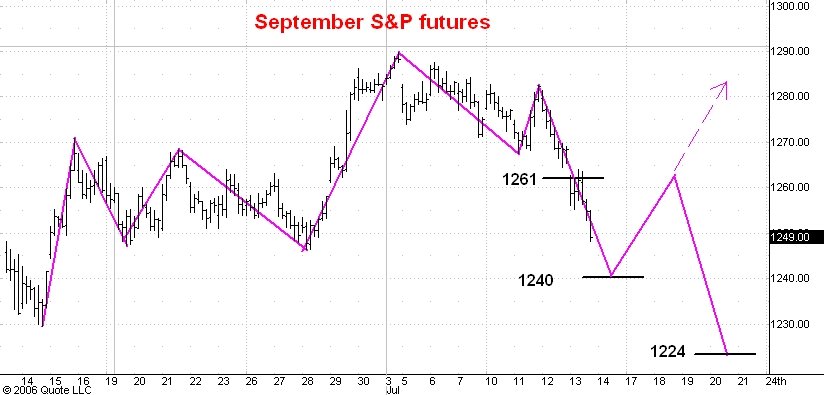
Here is an hourly chart showing regular hours trading in the September S&P e-mini futures.
Above it is a line chart showing the daily count of the number of issues which advance in price on the New York Stock Exchange. It also shows the five day (pink) and ten day (red) moving averages of this number. I commented on the S&P yesterday afternoon.
As you can see the market has dropped well below the 1261 level that I thought would be support. The significance of that level was that a low there would make the whole drop from 1290 look like a very symmetric three phase correction. However, what I thought would be the third and final phase of the correction is now much longer that the first phase (35 points vs. 22 points). Note also how today's number of advancing issues has made a new low for the drop from 1290.
These two facts are strong evidence that, after a rally from a low tomorrow or Monday, there will yet be another downleg in the drop from 1290. My guess is that the rally I am looking for will start from the 1240 level or so and carry the market up 20-30 points. Then we will see a final decline which will probably drop the S&P's to 1224.
I am still very bullish on this market and expect to see the 1350 level later this year.
Crude Oil
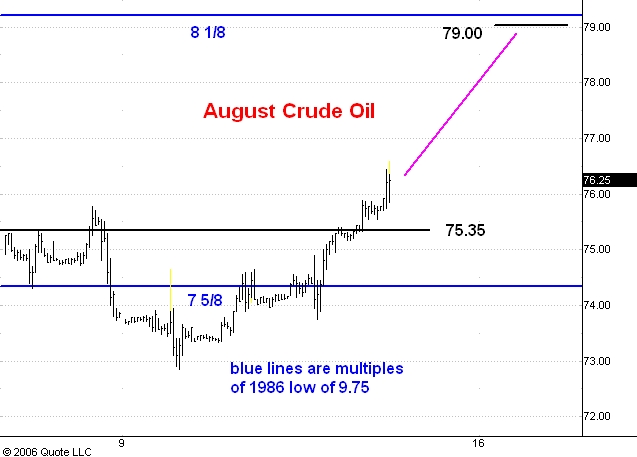
Here is an hourly bar chart showing pit and electronic trading in August crude oil futures. I last commented on this market here.
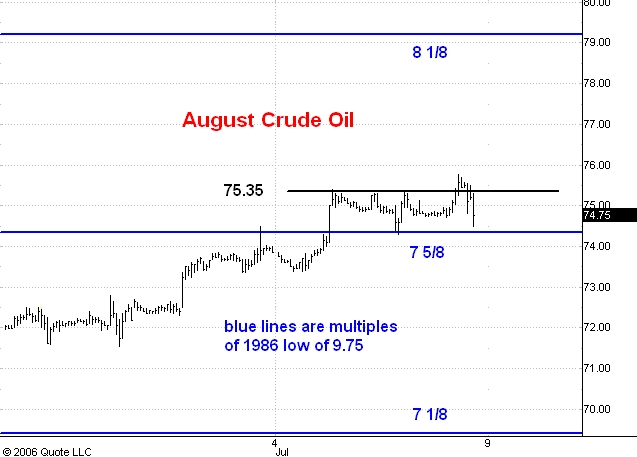
I think the market will close over the 75.35 level today and this will mean that it is heading for 79.20 which is the 8 and 1/8 multiple of the 1986 low of 9.75.
Guesstimates on July 13, 8:50 am ET
September S&P Futures: I think the S&P’s will hold support near 1261 and then rally to 1310. A move to new bull market highs is underway.
September Bonds: The bonds will probably drop to 106-16 and then rally to 108-16. The market is headed for the 110 level.
September 10 Year Notes: The notes should drop to support near 104-20 and then rally to 105-20.
Euro-US Dollar: The market will probably drop a bit further to 126.40. Weakness below 126.40 would force me to abandon my 131.00 target and look for an extended drop instead.
Dollar-Yen: The yen is headed for 118.00. I still think the yen will reach the 130 level over the next year.
August Crude: A close above the 75.35 level will mean that the market is headed for 78.00.
August Gold: Resistance above the market is at 655. The 662 level is my target for the rally from 547.
September Silver: Resistance is at 1200. The 1270 level is still my target for the rally from the 945 low.
Google: Support is at 405 and I think GOOG will soon move above its last high at 455.
Wednesday, July 12, 2006
S&P

Here is an hourly chart showing regular hours trading in the September S&P futures. I last commented on this chart yesterday afternoon.
I had thought that a move to 1310 was underway and that the market would hold support near 1272. As you can see the 1272 level has been broken decisively and a new low for the drop which began from the 1290 level has been made.
I now think this correction will end near 1261, the level at which the drop during the third phase of the correction would equal the drop during the first phase.
I still think that once this three phase correction is complete the market will move up to 1310 and eventually to 1350 later this year.
Guesstimates on July 12, 8:50 am ET
September S&P Futures: I think the S&P’s are on their way to 1310. Support today is at 1272. A move to new bull market highs is underway.
September Bonds: The bonds will probably drop to 106-16 and then rally to 108-16. The market is headed for the 110 level.
September 10 Year Notes: The notes should find support near 104-20 and then rally to 105-20.
Euro-US Dollar: The market broke 127.10 support this morning so will probably drop a bit further to 126.40. Weakness below 126.40 would force me to abandon my 131.00 target and look for an extended drop instead.
Dollar-Yen: The yen is headed for 118.00. I still think the yen will reach the 130 level over the next year.
August Crude: Resistance today is at 74.50. The market has started a swing down to the low of its recent trading range near 68.00. I think that low will be broken.
August Gold: Resistance above the market is at 655. The 662 level is my target for the rally from 547.
September Silver: Resistance is at 1200. The 1270 level is still my target for the rally from the 945 low.
Google: Support is at 405 and I think GOOG will soon reach 430. I expect to see the market reach the 450-500 zone this summer.
Tuesday, July 11, 2006
S&P Update

Here is an updated hourly chart of the September S&P futures. I discussed this chart about an hour ago.
As you can see the market rallied sharply after that last post. Since it had previously dropped to within 2 1/2 points of 1265 support I have to presume that the strong rally is telling us that the correction from 1290 is over. There is some supporting evidence in the behavior of the advancing issues indicator which I last discussed Friday.
The second chart above this post is an updated daily line chart of the daily count of the number of issues traded on the New York Stock Exchange which advance in price and the 10 day moving average of this number (red line). On both Friday and today the S&P's made new low's for the reaction which started from the 1290 level. Yet the daily advancing issues count has made successively higher lows on both days. This is a bullish divergence and is another reason to believe that the reaction is over.
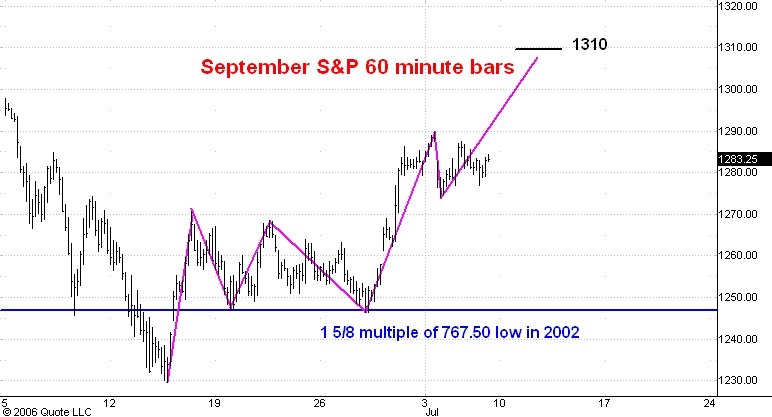
The next development should be a rally to 1310.
S&P

Here is an hourly chart of regular hours trading in the September S&P e-mini futures. I commented on this chart yesterday.
So far the market has dropped as low as 1267.50, close enough to 1265 support to admit the possiblity that the drop from 1290 is over. Even so, I don't yet see any persuasive evidence that the low has been made so I shall operate on the premise that the 1265 level will be reached or slightly breeched later today or tomorrow.
In any even I think the next significant development will be a rally to 1310.
Gold and Silver
Yesterday I commented on gold and silver. I said that I expected both markets to develop three phase reactions and that the rally from yesterday's low was only a second phase move which would stop at a lower top in both markets.
Today we are seeing more strength than I expected. August gold has actually made a new high for the rally from the 547 low in June. So I think August gold will reach 655 on this swing, close to the ultimate 662 target for the rally from 547. I think September silver will continue up to 1200 before another reaction sets in. My ultimate upside target for silver is still 1270.
Today we are seeing more strength than I expected. August gold has actually made a new high for the rally from the 547 low in June. So I think August gold will reach 655 on this swing, close to the ultimate 662 target for the rally from 547. I think September silver will continue up to 1200 before another reaction sets in. My ultimate upside target for silver is still 1270.
Eurodollars
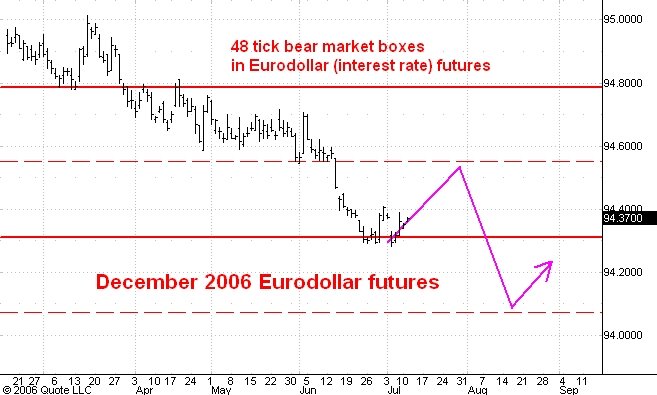
Here is a daily bar chart showing trading in the December three month eurodollar (interest rate) futures. Here is my last post on this market.
As you can see the market has reached the 94.30 level, the bottom of the current bear market box. In my last post on eurodollars I said that 94.30 would probably mark the end of the bear market which started from the 99.09 level in 2003.
I may turn out to be right about that, but my guess is that the Fed will as usual go a step too far in its policy of raising short term interest rates. So I am looking for this market to move up to the 1/2 point of its current box near 94.55. After that it will probably drop to 94.10 or so.
In any case, I think the drop from the 99.09 level is nearly over. As I have predicted in my 2005 and 2006 bond market forecasts, a new bull market in bonds and a big drop in interest rates, especially long rates, is just around the corner.
Guesstimates on July 11, 8:50 am ET
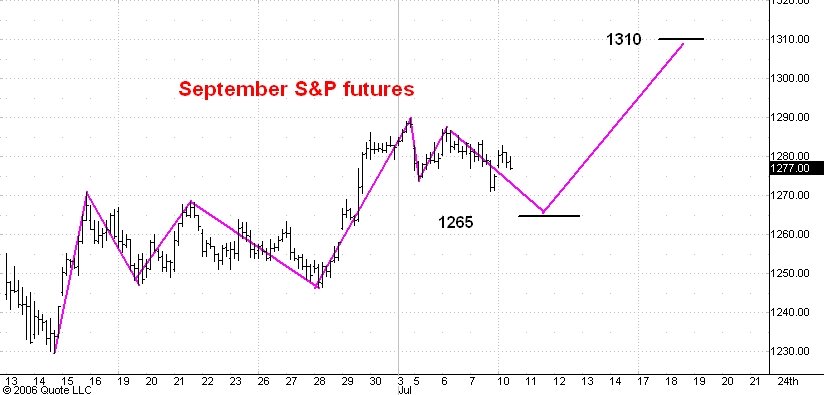
September S&P Futures: I think the S&P’s will drop to support at 1265 and then rally to 1310. A move to new bull market highs is underway.
September Bonds: My next upside target for the bonds is 107-20. Support today is at 106-20.
September 10 Year Notes: Next upside target for the notes is 105-12. Support is at 104-18.
Euro-US Dollar: The market has dropped as low as 127.05 and I think it now will climb to130.00. We should see the 131.00 level in a few weeks.
Dollar-Yen: The yen hasn’t quite made it to 113.10 but I think the market will stabilize here and prepare for a move to the 118.00 level. I still think the yen is headed for the 130 level over the next year.
August Crude: Resistance today is at 74.20. The market has started a swing down to the low of its recent trading range near 68.00. I think that low will be broken.
August Gold: Resistance today is at 634 and from there gold should drop to support around 618. After this correction is over I expect a move to 662.
September Silver: Resistance is at 1134. From there silver should drop to 1170. After this correction is over the move up to 1270 will resume.
Google: Support is at 405 and I think GOOG will soon reach 430. I expect to see the market reach the 450-500 zone this summer.
Monday, July 10, 2006
Silver

Here is an hourly chart showing pit and electronic trading in September silver futures. I last commented on this market here.
I think a three phase correction is underway and that it will end near the 1070 level. From there the market should resume its move to 1270 which is the 3 and 5/8 multiple of the 1991 low at 351.
I think the drop from 1270 will carry silver under the 900 level.
Gold

Here is an hourly chart showing pit and electronic trading in August gold futures. I lasts commented on this market here.
I think another correction of $20-25 is underway and will assume the ususal three phase shape before it is complete. Support is at 618 and from there I expect the market to resume its move to 662 which is the 2 and 5/8 multiple of the 252 low.
I think the drop from 662 will take gold under 500.
Guesstimates on July 10, 8:50 am ET
September S&P Futures: I think the S&P’s will drop to support at 1265 and then rally to 1310. A move to new bull market highs is underway.
September Bonds: My next upside target for the bonds is 107-20. Support today is at 106-20.
September 10 Year Notes: Next upside target for the notes is 105-12. Support is at 104-18.
Euro-US Dollar: Support at 127.10 is being tested again but I think it will hold. The next upside target is 130.00. We should see the 131.00 level in a few weeks.
Dollar-Yen: The yen should reach 113.10 today and then turn upward once more. I still think the yen is headed for the 130 level over the next year.
August Crude: The market has started a swing down to the low of its recent trading range near 68.00. I think that low will be broken.
August Gold: Gold is headed for 662. Support today is at 620.
September Silver: Silver is headed for 1270. Support today is at 1090.
Google: Support is at 400 and I think GOOG will soon reach 430. I expect to see the market reach the 450-500 zone this summer.
Friday, July 07, 2006
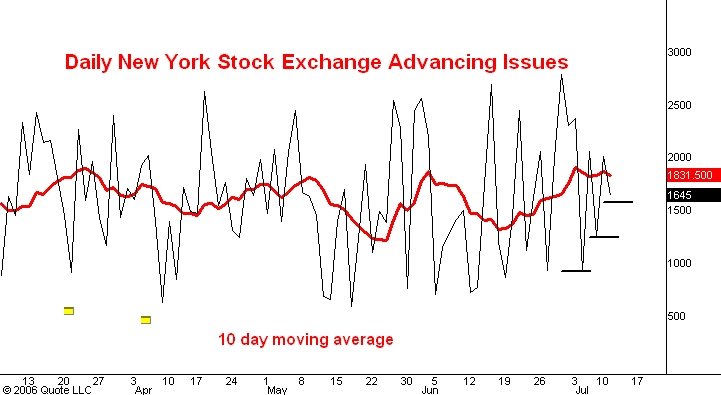
Advancing Issues
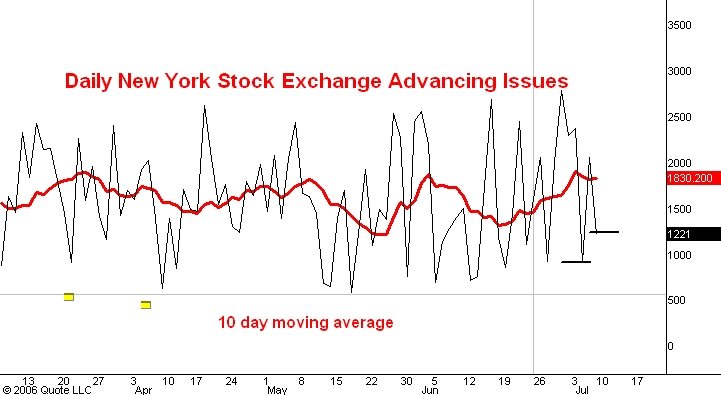
Here is a daily line chart showing the number of issues traded on the New York Stock Exchange that advance in price. The red line is the 10 day moving average of this number. I last commented on this indicator here.
Today we have made a new low for the reaction that started from Monday's high at 1289.75. But note that the daily number of advances is higher than it was Tuesday which was the first day of the reaction. So far this is only a minor divergence but it does make me more confident that the market won't go much past 1265 before it turns upward once more.
S&P Update

Here is an hourly chart showing regular hours trading in the September S&P e-mini futures. I commented on this chart earlier today.
Contrary to my expectation the market brokeout below the low of its recent trading range. So I am returning to the view I expressed earlier this week that the reaction will continue down to support near 1265. Now it definitely looks like a three phase move and I shall be expecting a move up to 1310 after the low point is reached.
T-bonds

Here is an hourly chart showing regular hours trading in the September T-bond futures. I last commented on this market here.
I had thought that the market would break below support at 105-12 and continue down to 104. But as you can see the 105-12 level has held like a rock. This makes me think that a breakout above resistance near 106-22 is imminent. If we close today above 106-22 I shall conclude that the bonds are headed up into the 110-111 zone.
S&P
Here is an hourly chart showing regular hours trading in the September S&P e-mini futures. I last commented on this market here.
This morning the market rallied in electronic trading after the employment number to 1290 but shortly after the open of regular hours trading it had dropped to 1277. I think that support at 1278 has held and that the S&P's have started a move which will break the top of the 1274-1290 trading range and carry the market to its next short term target at 1310.
Crude Oil
Here is an hourly chart showing pit and electronic trading in August crude oil futures. I last commented on crude oil here.
Crude oil has been locked in a trading range extending from its April 21 high of 75.35 to its May 17 low at 67.80. I still think that the market is likely to drop below the low of this range before it breaks above the high significantly. Even so, I am watching to see if we get a close above the 75.35 level. If this happens I will look for the rally to entend to 78.00 or so.
Guesstimates on July 7, 8:50 am ET
September S&P Futures: The S&P’s are now headed for 1310. Support is at 1278. A move to new bull market highs is underway.
September Bonds: My next upside target for the bonds is 107-20. Support today is at 106-20.
September 10 Year Notes: Next upside target for the notes is 105-12. Support is at 104-18.
Euro-US Dollar: Support at 127.10 held and the next upside target is 130.00. We should see the 131.00 level in a few weeks.
Dollar-Yen: The yen is headed for its downside target at 113.10. I still think the yen is headed for the 130 level over the next year.
August Crude: The market has moved a little above its old high at 75.35 and a close above that level will mean that it is heading for 78.00. I still think the more likely development will be a drop below 68.00 from here.
August Gold: Gold is headed for 662. Support today is at 620.
September Silver: Silver is headed for 1270. Support today is at 1110.
Google: Support is at 400 and I think GOOG will soon reach 430. I expect to see the market reach the 450-500 zone this summer.
Thursday, July 06, 2006
S&P
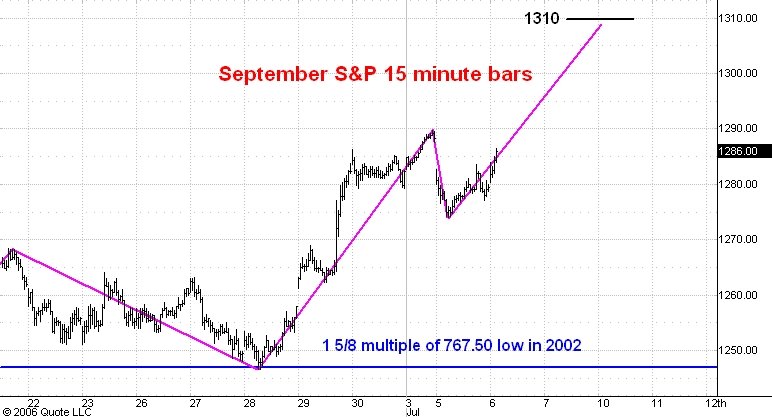
Here is a 15 minute chart showing regular hours trading in the September S&P e-mini futures. I commented on this chart yesterday.
I have been thinking that a three phase reaction was underway and would carry the market down to 1265 or so. But this morning the market rallied from the open and moved above yesterday's pit high at 1283.50. Since I am basically bullish on the S&P's I don't want to be left behind by an upswing. For this reason I shall now operate on the assumption that the reaction is over and that the market is headed for the 1310 level.
Guesstimates on July 6, 8:50 am ET
September S&P Futures: I expect the market to drop to 1265 or so and then to rally to 1310. I think the drop from the May 5 top ended at the June 14 low of 1229. A move to new bull market highs is underway.
September Bonds: So far support at 105-18 has held and this makes me think the market is headed back to 106-08 and probably higher.
September 10 Year Notes: So far support at 104-06 has held and it is likely the market will now head up to 105-08. If we can finish the week above 104-18 I shall conclude that the notes are headed for the 107-108 zone.
Euro-US Dollar: Support at 127.10 is holding and this means that the market should now rally to 130.00 or so. We should see the 131.00 level in a few weeks.
Dollar-Yen: Resistance today is at 115.60 and I am lifting my downside target from 111.50 to 113.10. I still think the yen is headed for the 130 level over the next year.
August Crude: The market has moved a few pennies above its old high at 75.35 and a close above that level will mean that it is heading for 78.00. I still think the more likely development will be a drop below 68.00 from here.
August Gold: Gold is headed for 662. Support today is at 610.
September Silver: Silver is headed for 1270. Support today is at 1090.
Google: Support is at 400 and I think GOOG will soon reach 430. I expect to see the market reach the 450-500 zone this summer.
Wednesday, July 05, 2006
S&P

Here is a 15 minute bar chart showing regular hours trading in the September S&P e-mini futures. I last commented on this chart here.
In this morning's guesstimate I said that support stood at 1277. As you can see the market has moved below that level. I now believe that we shall see a three phase correction which I expect to end near the 1265 level. The break from 1289.75 would there be just about equal in length to the last reaction which carried the market from 1270 to 1246.
Once this correction is complete I think we shall see the market rally to 1310 and eventually much higher than that.
Guesstimates on July 5, 8:50 am ET
September S&P Futures: Support today is a 1277. Next short term upside target is 1300. I think the market ended the drop from the May 5 top at the June 14 low of 1229. A move to new bull market highs is underway.
September Bonds: This morning the bonds dropped back below the 106-08 level so I conclude the market is headed down to 105-18. If we finish this week above 106-08 I will conclude that the market is headed for 110.
September 10 Year Notes: The notes are headed for the 104-06 level. If we can finish the week above 104-18 I shall conclude that the notes are headed for the 107-108 zone.
Euro-US Dollar: The trend has turned upward and the market is headed for the 131.00 level. Support today is again at 127.10.
Dollar-Yen: The yen has decisively broken below support at 115.00 so I conclude that the market is headed down to 111.50. Resistance is again at 115.10 today. I still think the yen is headed for the 130 level over the next year.
August Crude: This market has been much stronger than I have expected. I still think that the 75.35 top will hold and that the next big move will be a drop below 68.00.
August Gold: Gold is headed for 662. Support today is at 610.
September Silver: Silver is headed for 1270. Support today is at 1090.
Google: Support is at 400 and I think GOOG will soon reach 430. I expect to see the market reach the 450-500 zone this summer.
Monday, July 03, 2006
Guesstimates on July 3, 8:50 am ET
September S&P Futures: Support today is a 1277. Next short term upside target is 1300. I think the market ended the drop from the May 5 top at the June 14 low of 1229. A move to new bull market highs is underway.
September Bonds: Friday the market broke past resistance at 106-08. This is a clue that the trend may be turning upward again. If we finish this week above 106-08 I will conclude that the market is headed for 110. Meantime support is at the old resistance level at 106-08.
September 10 Year Notes: Friday the market broke past 104-18 resistance. If we finish this week above that level I shall conclude that the notes are headed for the 107-108 zone. Meantime support is at 104-12.
Euro-US Dollar: The trend has turned upward and the market is headed for the 131.00 level. Support today is at 127.10.
Dollar-Yen: The yen has decisively broken below support at 115.00 so I conclude that the market is headed down to 111.50. Resistance is at 115.10 today. I still think the yen is headed for the 130 level over the next year.
August Crude: This market has been much stronger than I have expected. I still think that the 75.35 top will hold and that the next big move will be a drop below 68.00.
August Gold: Gold is headed for 662. Support today is at 610.
September Silver: Silver is headed for 1270. Support today is at 1090.
Google: Support is at 400 and I think GOOG will soon reach 430. I expect to see the market reach the 450-500 zone this summer.
Subscribe to:
Posts (Atom)