
Here is an updated hourly chart of the September S&P futures. I discussed this chart about an hour ago.
As you can see the market rallied sharply after that last post. Since it had previously dropped to within 2 1/2 points of 1265 support I have to presume that the strong rally is telling us that the correction from 1290 is over. There is some supporting evidence in the behavior of the advancing issues indicator which I last discussed Friday.
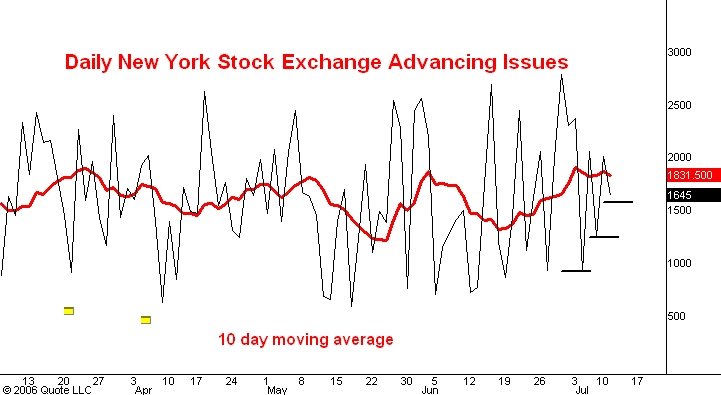
The second chart above this post is an updated daily line chart of the daily count of the number of issues traded on the New York Stock Exchange which advance in price and the 10 day moving average of this number (red line). On both Friday and today the S&P's made new low's for the reaction which started from the 1290 level. Yet the daily advancing issues count has made successively higher lows on both days. This is a bullish divergence and is another reason to believe that the reaction is over.
The next development should be a rally to 1310.
No comments:
Post a Comment