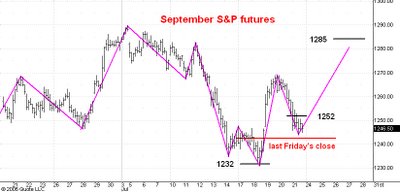
Here is an updated hourly chart of the September S&P e-mini futures. I last commented on this chart here.
In this morning's guesstimate I revised my estimate of support downward from 1258 to 1252. But as you can see the market has spent almost the entire day trading below 1252.
Even so, I am going to stick with my view that the market will move above 1270 before it drops below 1231. My intial upside target is now 1285. My reason's are as follows.
First, seven of the past eight trading days have been days on which there has been persistent selling pressure. Even so, the market has held above its 1229 low. Another application of the "dog that didn't bark" principle makes me think that the buyers during the past two weeks have more patience (and quite possibly more money) than the sellers, especially given the distressing news backround: turmoil in the middle east, terror bombings in India, oil at historical highs, etc.
Second, as I pointed out Wednesday, the 5 and 10 day moving averages of the daily advancing issues number have remained above their last two low points and this is a bullish divergence.
Third, the move up from the 1231 low on Tuesday does not yet have the classic three phase shape that most corrective moves have. This makes me think that the drop from 1269 is at worst only the middle phase of a move up from 1231 which is not yet complete.
Finally, the market remains above last Friday's close and has traded above that close for the better part of this week. This is one of my simple indicators of the trend direction and it is still favoring the bull side.
All in all I am led to expect a low, probably above last Friday's close at 1242 which will be followed at least by a rally to 1285. Moroever this rally may well prove to be the intial phase of a move to the 1350 level.
No comments:
Post a Comment