Here is a highly condensed daily chart of the Dow Jones Industrial average going back to June of 2004. On this chart I have updated my estimate of the market's current position within what I think are two ongoing examples of Lindsay's Three Peaks and a Domed House formation. I have also appended a schematic chart of the ideal three peaks and a domed house with the corresponding numbering.
As I explained in my last post on this subject I think the market has completed the domed house of the major formation (labeled with blue numerals). The domed house comprised points 21, 23, and 25. In this major formation (blue) you can see that the domed house is quite lopsided, leaning in the "bearish" direction. Another anomaly of this major formation is that the 7 month, 10 day time period from point 14 at best timed point 25, and that not very well.
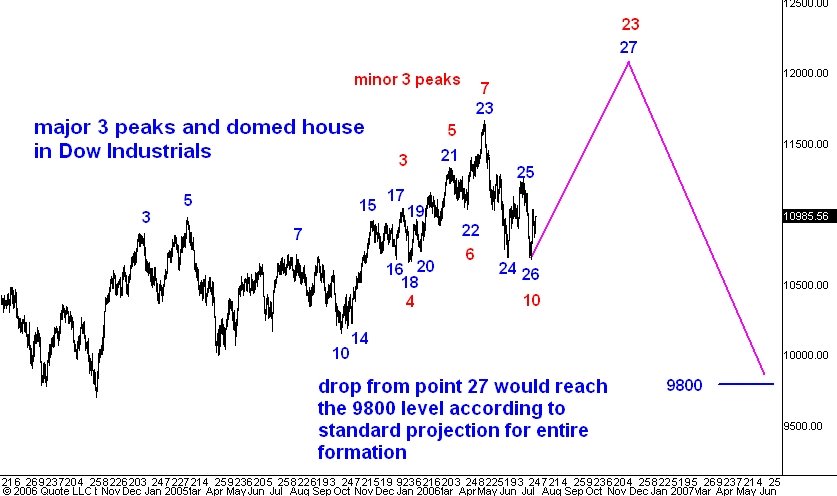
The issue now is just how high will the Dow rally to establish point 27. As I explained in the last post one way to resolve this question is to observe that there is a minor three peaks visible on the same chart. This I have labeled with red numerals. The difference between a minor and major formation is this. In a major formation points 3 and 7 are separated by 6-10 months while in a minor formation they are separated by only 2-4 months.
I might add at this point that this is one reason why so many people misapply Lindsay's theory of this formation. If someone draws a three peaks for you in which points 3 and 7 are separated by more than 12 months you can be sure that you are not looking at a Lindsay Three Peaks and a Domed House formation.
In any case, the minor formation in red has completed its three peaks and its separating decline to red point 10. The next phase should be the domed house which almost always carries the market above the highest of the preceeding three peaks. Thus I expect red point 23 to coincide with blue point 27 and to occur at a new high for the bull market which began at the 7200 level in 2002.
As far as timing red point 23 (= blue point 27) I am inclined to expect the top 7 months and 10 days from red point 6. Thus I would project a top for late November 2006, probably close to the 12000 level in the Dow.
In any event, the forecast for the completion of the major (blue) formation is clear. According to Lindsay, the drop from point 27 should carry the Dow down to the start of this major formation. I estimate this to be the 9800 level in the Dow.
No comments:
Post a Comment