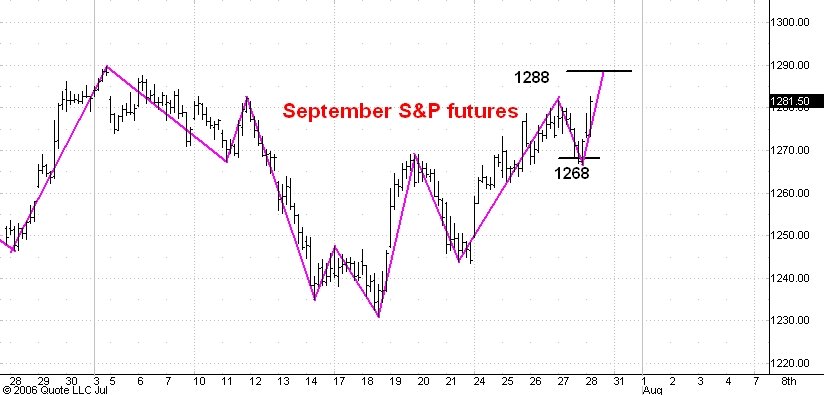
Here is an hourly chart of the September S&P e-mini futures. I last commented on this chart yesterday.
The market bounced off of support at 1268 and in this morning's guesstimate I said that I thought the bounce was the second phase rally and would stop around 1276. But the market is proving even stronger than I have expected and a short while ago broke above yesterday's high at 1281.75. I now think this upmove will continue to 1288 or so (the July 7 high was 1290 in electronic trading).
The main thing to keep in mind is that this upmove is only the initial stage of a move to 1350 and above which should develop over the next 3-4 months.
3 comments:
Carl, do you expect a slight correction at 1288-1290?
Carl,
i happened to save this link http://carlfutia.blogspot.com/2005/10/three-peaks-and-domed-house.html
some times ago, and incidentally i clicked it today.
Well, that was a hell of a call:
Adding 7 months 10 days to this predicts a top for the domed house on May 8.
The market topped 2 days later!
Reading your blog i see you're still bullish for a move to a new high.
What is it of that october call then?
It worked so perfectly that i wonder why you're dismissing it now (labelling also fit perfectly with the way the dow reached the top in may too).
I dont come here often, so maybe you've already written about this, but i'd appreciate if you could tell me more, or else link me to some earlier post.
Thanks
Gibaryan:
Thank for bringing my attention to that post. In fact I added incorrectly in that post. October 28, 2005 plus 7 months and 10 days gives a predicted top for JUNE 8, not for MAY 8 as I had written in that post.
I have just added a note to that post pointing out the error.
Carl
P.S. Sometimes it is better to be lucky than it is to be good!
Post a Comment