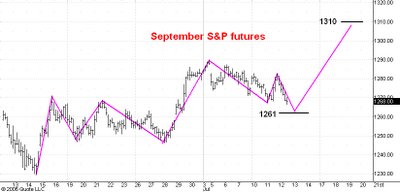
Here is an hourly chart showing regular hours trading in the September S&P futures. I last commented on this chart yesterday afternoon.
I had thought that a move to 1310 was underway and that the market would hold support near 1272. As you can see the 1272 level has been broken decisively and a new low for the drop which began from the 1290 level has been made.
I now think this correction will end near 1261, the level at which the drop during the third phase of the correction would equal the drop during the first phase.
I still think that once this three phase correction is complete the market will move up to 1310 and eventually to 1350 later this year.
No comments:
Post a Comment