
Here is an hourly chart showing regular hours trading in the September S&P e-mini futures.
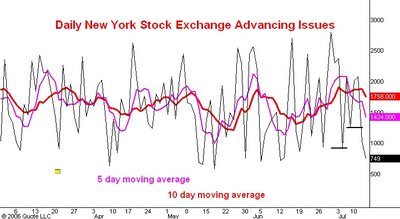
Above it is a line chart showing the daily count of the number of issues which advance in price on the New York Stock Exchange. It also shows the five day (pink) and ten day (red) moving averages of this number. I commented on the S&P yesterday afternoon.
As you can see the market has dropped well below the 1261 level that I thought would be support. The significance of that level was that a low there would make the whole drop from 1290 look like a very symmetric three phase correction. However, what I thought would be the third and final phase of the correction is now much longer that the first phase (35 points vs. 22 points). Note also how today's number of advancing issues has made a new low for the drop from 1290.
These two facts are strong evidence that, after a rally from a low tomorrow or Monday, there will yet be another downleg in the drop from 1290. My guess is that the rally I am looking for will start from the 1240 level or so and carry the market up 20-30 points. Then we will see a final decline which will probably drop the S&P's to 1224.
I am still very bullish on this market and expect to see the 1350 level later this year.
No comments:
Post a Comment