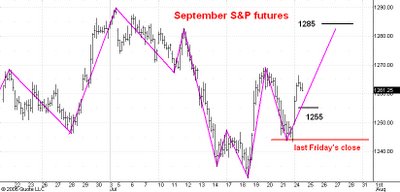
Here is an hourly chart of the September S&P e-mini futures. I last commented on this chart here.
I think a move to 1285 is underway. Support is at 1255 but if the market is as strong as I think I doubt that any reaction will actually reach that level. I have drawn a red line at the level of last week's close. As long as the market trades above there I shall remain confident that the trend is upward.
I also think that 1285 will only be a temporary stop on the road to 1350 which I think will be reached later this year.
No comments:
Post a Comment