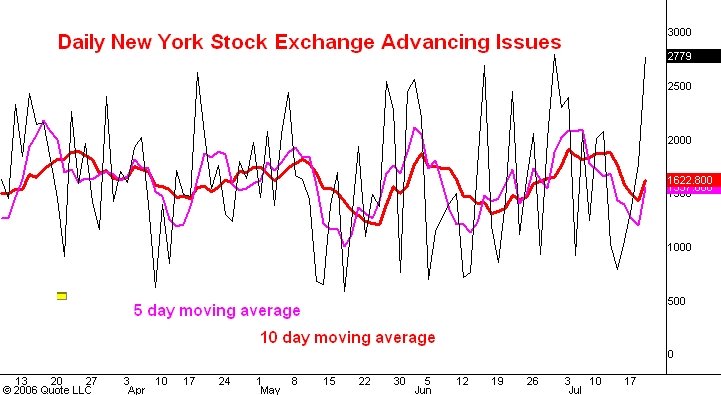
Here is a daily line chart of the number of issues traded on the New York Stock Exchange that advance in price. The pink and red lines are the five and 10 day moving averages of this number. I last commented on this indicator here.
Earlier today I said that I thought the September S&P futures were probably headed for the 1280 level. This chart of the advancing issues number reinforces that view.
The most significant thing I see in this chart is that both the 5 and the 10 day moving averages have made two consecutive higher lows, even as the S&P made a lower low and then a double bottom while the Nasdaq compostite has made lower lows. I regard this as a bullish divergence. In fact, it is making me suspect that the market won't stop at 1280. Indeed, a close above the 1285 level would convince me that a move to 1350 is underway.
No comments:
Post a Comment