Tuesday, October 31, 2006

S&P Update


Here is an hourly chart of the December S&P futures. I commented on this market earlier today.

From its 1377 low around noon the market has rallied 6 points. The last rally was 8.50 points so I think this rally won't go past 1385-86 before the market resumes is drop to 1369.

Lehman Bros. iShares Bond ETF


Here is a daily chart of an exchange traded fund, iShares Lehman Brothers 20 year treasury bond index (symbol TLT). This ETF is traded on the Amex.

One expects the price of this fund to track long term treasury bond prices pretty closely. You can see it made its low this year in May coincident witht the low in 30 year treasury bond prices and since has been rallying in what I believe to be a new bull market in bonds.

I have drawn boxes on the chart which ar 3.38 points high. TLT is a stock that seems to prefer bouncing between the 1/3 division points of its boxes and I have drawn these as dotted red lines. The tops and bottoms of boxes are shown as solid red lines.

I think TLT is now headed for the 93.80 level which is the 1/3 divion point of the next higher box.

December S&P 30 minute bars

S&P

Here is a 30 minute bar chart of the December S&P futures. I last commented on this market here.

A little after the open today the market rallied to 1387.25 and since then it has been pretty much all downhill. I think this swing will carry to the 1369 downside target over the next day or so.

I have drawn the boxes which I believe are controlling the drop from 1395.25. Note that the 1/2 point of the current box is near 1370. Since markets stop swings at the 1/2 point of boxes more often than at the top or bottoms of boxes we have another reason to think that the correction will end near 1370. The 1370 level was the low on October 23 which ended a drop of 28 points from the electronic high of 1398 the previous evening. Finally, the drop from the high on September 5 to the low on September 11 amounted to 25 points and this is yet another reason to expect support near 1370.

Gold


Here is an hourly chart showing pit trading in December gold futures. I last commented on this market here.

Gold has held support at 600 and I think it will rally at least to 618 and possibly all the way to 625. In either case I also think this is the last gasp of the rally from 563 and that the next big move in gold will carry it down below 500.

T-bonds


Here is an hourly chart of December T-bond futures. I last commented on this market here.

The move above 111-08, the last high prior to the low at 109-27, forced me back to the bullish side of this market. The rally has been very persistent but shows low volatility. This tells me that it has much further to go because significant trends typically begin and end during periods of relatively high volatility.

No obvious boxes formed on the way up from 109-27 so I must fall back on other methods to estimate support and resistance. The first level above 111-08 that catches my attention on this chart is the low at 112-01 on September 29. The market is now stalling at that level but I think it will break through, perhaps after a reaction of 20 ticks or so.

In my opinion a more important resistance level stands at 113-00, the high made right after the release of the last employment number on October 6. Sellers became very aggressive there and I expect we shall see some "nostalgia" selling when the market makes it back to that level. Even then I doubt the market will drop much below 112-00.

The low at 105-11 in May marked the start of a new bull market in bonds. The swing up from 109-27 should carry to 115 at least and quite possibly higher than that.

Guesstimates on October 31, 8:50 am ET

December S&P Futures: I expect resistance above the market at 1388-89 to hold today. The next significant swing should be downward to support near 1369. After that a move into the 1410-20 range should develop.

December Bonds: The trend has turned upward in the bonds and that the market is headed for the 115 level. Resistance is at 112-30 while support today is at 111-16.

December 10 Year Notes: The trend has turned upward and the notes are now headed for 110-16. Resistance above the market is at 108-04. Support today is at 107-16.

Euro-US Dollar:  The euro is headed back up into the 129-130 zone. Support today is still at 126.30 while the next upside target is 128.50.

Dollar-Yen: It looks like the trend in the yen has turned downward and that the market is headed for the 116-117 zone. I expect to see the yen at 130 next year.

December Crude:  The market broke right through what I thought was support at 59.20.  It should hold 57.20 thought and then move up to 62.00 or so.

December Gold: Gold hit 613 yesterday but silver only made it to 1230.  Weakness in gold below 600 will convince me that the market has turned down and is headed below 545.

December Silver: Silver made a slightly higher high at 1230 yesterday but hasn’t yet reached the 1250 target.  Weakness below 1200 today will convince me that the trend has turned downward and that silver is headed below 900.  

Google:  GOOG will soon reach its initial 507 target and then move on to its higher 564 target.  Support is at 466.  

Monday, October 30, 2006


December S&P futures

S&P Update

Here is an hourly chart of the December S&P e-mini futures. I commented on this market this morning.

So far the S&P's have made it up to 1386.50. I don't think the market will make it past 1388.50 before it resumes its move to 1369.

S&P


Here is an hourly chart of the December S&P e-mini futures. I last commented on this market here.

The market has bounced off of support near 1379 and will probably halt its rally in the vicinity of the early morning low at 1386.75 last Friday.

I think the drop from Thursday's high of 1395.25 will last another day or two and carry the market to 1369 or so. After the drop is over I expect the market to climb into the 1410-20 zone.

Guesstimates on October 30, 8:50 am ET

December S&P Futures: Support today is at 1379. Resistance above the market is at 1388. I think the S&P’s are on the way down to 1369. In any case I expect to see a 1415 print later this year.  

December Bonds: The trend has turned upward in the bonds and that the market is headed for the 115 level. Support today is at 111-112.

December 10 Year Notes: The trend has turned upward and the notes are now headed for 110-16. Support today is at 107-16.

Euro-US Dollar:  The euro is headed back up into the 129-130 zone. Support today is at 126.30 while the next upside target is 128.50.

Dollar-Yen: It looks like the trend in the yen has turned downward and that the market is headed for the 116-117 zone. I expect to see the yen at 130 next year.

December Crude:  The market should find support near 59.20 and then rally to 63.00. before turning lower again.  

December Gold: I think the market will reach 613 or so before beginning its drop to 545 and below.

December Silver: It looks like silver can rally some more to 1250 or so before starting its drop to below 900.

Google:  GOOG will soon reach its initial 507 target and then move on to its higher 564 target.  Support is at 462.  

Friday, October 27, 2006


December S&P hourly bars

S&P Update

Here is an hourly chart of the December S&P e-mini futures. I commented on this market earlier today.

I had thought that the S&P's were headed up to 1398 from the 1386.75 higher low this morning. The market rallied for about three hours but it was a struggle all the way. Then contrary to my expectation a break below this morning's low developed.

This is the first time in more than a week that an obvious lower top is visible on the hourly charts. I think this means that yesterday's 1395.25 high did in fact begin a 20-30 point break.

S&P 5 minute bar chart

S&P

Here is a 5 minute bar chart of the December S&P e-mini futures. I last commented on this market here.

The break from yesterday's high at 1395.25 has so far just about equalled the size of the last two breaks and has ended at a higher low. The market gapped downward this morning and then even more selling pressue developed. But the whole selling squall ended in 20 minutes. Since then there are two higher lows visible on the 5 minute bar chart.

I think this market is now headed for 1398 and from there it will begin the 20-30 point break I am anticipating. Remember that 1398 was the high print this past Sunday night.

Guesstimates on October 27, 8:50 am ET

December S&P Futures: Support today is at 1379. Resistance above the market is at 1395. I think the S&P’s are about to start a break of 20-30 points. In any case I expect to see a 1415 print later this year.  

December Bonds: Strength on the GDP news this morning means that the trend has turned upward in the bonds and that the market is headed for the 115 level. Support today is at 111-08.

December 10 Year Notes: The trend has turned upward and the notes are now headed for 110-16.

Euro-US Dollar:  The market has moved above resistance in a rally that has lasted longer and gone farther than any rally since the 129.38 high in August. The euro is headed back up into the 129-130 zone.

Dollar-Yen: It looks like the trend in the yen has turned downward and that the market is headed for the 116-117 zone. I expect to see the yen at 130 next year.

December Crude:  The market should rally into the 62.00 to 63.00 zone before turning lower again.  

December Gold: I now think the market will head up to 613 or so before beginning its drop to 545 and below.

December Silver: It looks like silver can rally some more to 1250 or so before starting its drop to below 900.

Google:  GOOG will soon reach its initial 507 target and then move on to its higher 564 target.  Support is at 462.  

Thursday, October 26, 2006


December T-bonds

The Two Iron Laws of Speculation

Here is a daily bar chart of December T-bond futures. I last commented on this market here.

I still think this market is headed lower, but it is at junctures like this that I constantly remind myself of the two Iron Laws of Speculation:

Iron Law # 1 - Never fight the trend.

Iron Law # 2 - Never forget Iron Law # 1

The market appears ready to close above its last high on the way down at 111-06. This is the third day of the rally from 109-27 and we have had two previous rallies, one of 2 days and one of 3 days. If the market shows strength above today's high tomorrow I will conlcude that it is headed to 115 instead of to 108.

S&P Update


Here is an hourly chart of the December S&P e-mini futures. I commented on this market earlier today.

The market stopped a point shy of 1384 support this morning and now appears ready to make new highs for the move instead of the lower top I expected this morning. However I think the S&P's will stall near 1395 and then drop in the first phase of a three phase reaction to 1379 or so.

S&P


Here is an hourly chart of the December S&P e-mini futures. I last commented on this market yesterday.

I think the market has begun a break which will carry it down roughly to 1369. I came up with this level by noting that Sunday night the e-minis traded up to 1398 and by early Monday morning had dropped to 1370 before beginning the rally which took the market to 1393.75 this morning. So 1393.75 is in fact a top below 1398 and thus I would expect the market to break below 1370. But since conditions are still quite bullish in my estimation I don't think the break below 1370 will be by much.

The chart shows my best guess for the course of the correction. The S&P's have already dropped near the 1384 level which I think will be temporary support. Then I would expect a 5-7 point rally followed by another break to 1378-80. Then a bigger rally to a lower top followed by the final phase of the correction to 1369. But remember this is only a guess and I shall try to adapt to changing circumstances as the price pattern evolves.

Chart of NYSE Advancing Issues

Advancing Issues

Here is a line chart of the daily count of the number of issues traded on the New York Stock Exchange which advance in price. I last commented on this indicator here.

The black line on the chart is the daily count of advancing issues. The purple line is the 5 day moving average of this number. The horizontal red line is the level I am currently using to indicate an "overbought" condition for the 5 day moving average. The light green and the dark green horizontal lines are repectively the moderate and the severe "oversold" levels for the 5 day moving average.

Notice that on October 16 the moving average kissed the overbought level and has since fallen away while the market averages have moved higher. Along the same lines the daily count shows two lower tops since its recent peak on October 12. This situation shows a moderate divergence after reaching overbought levels and as such has mild bearish implictations.

This is one reason I am currently expecting a 20-30 point break. If it materializes I think the low of the break will develop on or after the 5 day moving average touches the light green line indicating a moderate oversold condition. I would also expect to see the daily count of advancing issues start to move upwards before the reaction low is in place.

Guesstimates on October 26, 8:50 am ET

December S&P Futures: Support today is at 1384. The market has rallied to 1393.75 so far today.  I think the S&P’s are about to start a period of sideways action from which will develop a break of 20-30 points. In any case I expect to see a 1415 print later this year.  

December Bonds: The market is trading above what I thought was resistance at 110-24.  I won’t turn bullish however unless this moves carries above 111-08 and stays above 111-00.  In the meantime I still expect to see the bonds trade in the 107-108 zone within a few weeks.

December 10 Year Notes: Resistance today is at 107-12. I think the market is headed down into the 104-16 to 105-16 zone over the next few weeks.

Euro-US Dollar:  Resistance today is 126.80. I still think that the Euro is headed down to 123.50.

Dollar-Yen: The yen should soon reach 121.00. Support today is at 118.50. I expect to see the yen at 130 next year.

December Crude:  The market should rally into the 62.00 to 63.00 zone before turning lower again.  

December Gold: I think I misjudged gold’s immediate trend.  I now think the market will head up to 613 or so before beginning its drop to 545 and below.

December Silver: I think I misjudged silver’s immediate trend. I now think the market will continue up to 1230 before starting its drop to below 900.

Google:  GOOG will soon reach its initial 507 target and then move on to its higher 564 target.  Support is at 462.  

Wednesday, October 25, 2006

S&P


Here is an hourly chart of the December S&P e-mini futures. I last commented on this market here.

After the Fed news the market moved to within 1/2 point of the 1390 resistance level. It then droped 8 points, just a tad more than the two previous 6 - 7 point reactions I have highlighted in blue. I think the S&P's will rally from here to 1392 or so before dropping at least to 1379 and possibly to 1365.

Low S&P Volatility

Brett Steenbarger has posted a pair of articles here and here in which he discusses bullish and bearish implications of various levels of volatility in the S&P 500 index.

I think his principal observation is that periods of unusually low volatility, like the one we are in now, are generally followed by periods of rising stock prices. Bear markets are likely to begin and to end during periods of relatively high volatility.

This matches well with my own observations and is yet another reason why I think any break in stock prices from current or slightly higher levels will be brief and relatively shallow ( 10 to 15 % in the averages.

Oil Service HOLDRS


Here is a daily chart of the oil service HOLDRS. I last commented on this market here.

I think the rally from 118 is just about over. It has reached the top of the current red box and has equalled the length of the biggest previous rally on the way down from 169. The next move down should eventually carry the market to 100 or below but this will take some time to develop.

Bull Fighting


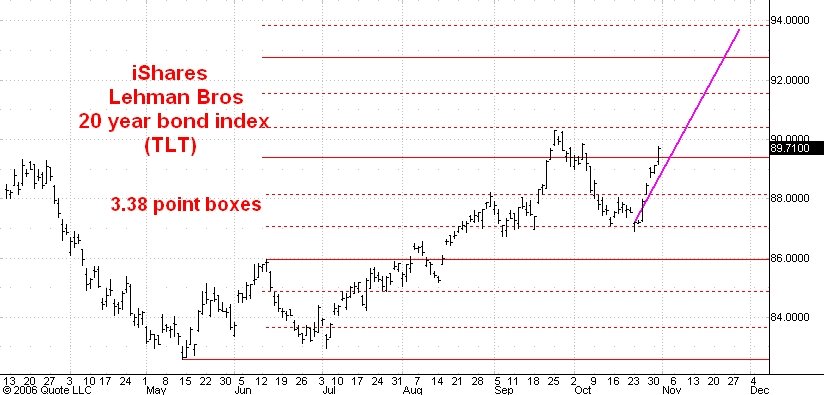
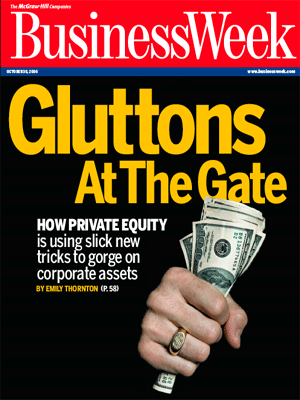
Here is the latest cover of Business Week Magazine. Yet another story about capitalist tricksters hollowing out corporate America. Nary a word about the fact that the buyout and merger boom is bull market fuel and as such is rocketing the stock market averages upward.

This "good news is bad" theme has been prominent in the Main Stream Media the past few weeks as the Dow industrials first surpassed the average's 2000 peak at 11750 and then lept over the 12000 mark. Here are a few story headlines which illustrate my point:

"Beneath the Dow's Surge, Investors Find a Mixed Bag" , Wall Street Journal, September 30

"Is the Corporate Profit Machine About to Sputter?" , New York Times business section, Oct. 1

"As Dow Surges, Many Left Behind" , Chicago Tribune, page 1, October 4

"Don't Get Excited. It's Just the Dow." , Newsweek, Allan Sloan's column, October 16

"Blue Chip Gains Rouse Bears", Wall Street Journal, October 16

"Viewed From Abroad, the Dow at 12000 Isn't So Impressive" , New York Times, Floyd Norris, October 21

All this bull fighting makes me think that even my optimistic expectations for stock prices may be too conservative. I really don't think an important bull market top is likely until we see some bull market cheer leading by members of the Main Stream Media.

T-bonds


Here is an hourly chart of the December T-bond futures. I last commmented on this market here.

I thought that the 110-10 level would be resistance but the market accelerated above that level a little while ago. You can see this action on the chart as the expanded range hourly bar with its close above the 110-10 level. I think this means that the bonds are headed to the top of the current box at 110-24. Such a rally would be nearly as big as the last rally on the way down too.

After the 110-24 level is reached I expect the market to resume its move down into the 107-108 range.

Guesstimates on October 25, 8:50 am ET

December S&P Futures: Support today is again at 1378. I expect to see the S&P’s trading at 1390 today or tomorrow.  In any case I expect to see a 1415 print later this year.  

December Bonds: Resistance is at 110-10 and I think the market will soon be trading at 109-20. Over the next few weeks the bonds should drop into the 107-108 zone.

December 10 Year Notes: The notes should soon be trading at 106-08.  I think the market is headed down into the 104-16 to 105.16 zone over the next few weeks.

Euro-US Dollar:  The Euro is headed down to 123.50. Resistance today is at 125.90.

Dollar-Yen: The yen should soon reach 121.00. Support today is at 119.00. I expect to see the yen at 130 next year.

December Crude:  The market is holding  58.40 support and I expect a rally of 4 to 5 dollars to develop from current levels.

December Gold: Resistance today is at 590. The market should reach 545 in a week or two.  Gold has begun a drop to below 500.

December Silver: Resistance today is at 1190. The 1120 level is short term support. A drop to below 900 is underway.

Google:  GOOG will soon reach its initial 507 target and then move on to its higher 564 target.  Support is at 455.  

Tuesday, October 24, 2006

S&P


Here is an hourly chart of the December S&P e-mini futures. I last commented on this market here.

As you can see the market is holding support at 1378. I remain convinced that we shall soon see at 1390 print, probably after the Fed announcement tomorrow at 2:15 pm ET.

Guesstimates on October 24, 8:50 am ET

December S&P Futures: Support today is at 1378. I expect to see the S&P’s trading at 1390 in a day or two.  In any case I expect to see a 1400 print later this year.  

December Bonds: Resistance is at 110-10 and I think the market will soon be trading at 109-20. Over the next few weeks the bonds should drop into the 107-108 zone.

December 10 Year Notes: The notes should soon be trading at 106-08.  I think the market is headed down into the 104-16 to 105.16 zone over the next few weeks.

Euro-US Dollar:  The Euro is headed down to 123.50.

Dollar-Yen: The yen should now rally to 121.00. I expect to see the yen at 130 next year.

December Crude:  The market is holding  58.40 support and I expect a rally of 4 to 5 dollars to develop from current levels.

December Gold: Gold has begun a drop to below 500. The market should reach 545 in a week or so.  

December Silver: Silver stopped 3 cents shy of 1220 resistance and now has begun a drop to below 900. The 1120 level is short term support.

Google:  GOOG will soon reach its initial 507 target and then move on to its higher 564 target.  Support is at 455.  

Monday, October 23, 2006

S&P Update


Here is an hourly chart of the December S&P e-mini futures. I commented on this market earlier today.

You can see that the market completed an expanded range, down hour with a low at 1378.75 about an hour ago. Note that the low of the hour was above the 1378.25 high made on October 16. The market then rallied strongly from its hourly low.

The 1378.25 high is support. More often than not the market looks not to the last high but to the one before than for support in an uptrend.

I think the S&P's will be trading at 1390 in a day or two.

ES Spike Last Night

For the curious I have some additional information about the spike from 1375 to 1398 and back down again last night in the December S&P e-mini futures. (Thanks to Tim Mack.)

Apparently a fairly large short futures position connected with options with a 1375 strike was covered at the Globex open. According to the Merc the painful fills that resulted were not errors.

Google daily bar chart

Google

Here is a daily bar chart of Google. I commented on GOOG Friday.

I think the price action Friday and so far today in GOOG is extremely bullish. Here is why.

There have been several postitive earnings surprises in GOOG since its IPO in 2004. After each of these surprises the stock price gapped up and then reacted substantially. This is the first time I have seen GOOG gap upwards after a postitive surprise, close strong that day, and then move substantially higher the next (GOOG made new historical highs this morning.)

This departure from the norm is very bullish. I think it means that the 507 target is too conservative. The next fibonacci target is 564 which is 233 points above the March'06 low at 331 as well as 89 points above the previous high at 475. I think GOOG will reach this latter target before it reacts as much as 100 points.

( Here is the first post I ever made on GOOG.)

S&P


Here is an hourly chart of the December S&P e-mini futures. I last commented on this market here.

The market has accelerated above 1376 resistance this morning. Coupled with the sequence of higher lows you see underlined on the chart and the generally bullish condition of the market this means that the S&P's are headed for 1390.

Guesstimates on October 23, 10:10 am ET

December S&P Futures: For the time being I am going to ignore the e-mini performance right after the globex open last night.  The market apparently ran through a nest of stops above 1380 and two minutes later was trading at 1398. Then it collapsed within the next 5 minutes back below 1380 and so far today has traded as low as 1370.  I am still leaning on resistance at the 1376 level and expecting the market to drop to 1362 and eventually into the 1350-55 zone. Strength above 1376 will turn me short term bullish again. In any case I expect to see a 1400 print later this year.  

December Bonds: The bonds broke support at 110-12 early this morning and so I think the market will soon be trading at 109-20. Over the next few weeks the bonds should drop into the 107-108 zone.

December 10 Year Notes: The notes should soon be trading at 106-08.  I think the market is headed down into the 104-16 to 105.16 zone over the next few weeks.

Euro-US Dollar:  The Euro is headed down to 123.50.

Dollar-Yen: The yen has reached support near 118.10 and should now rally to 121.00. I expect to see the yen at 130 next year.

December Crude:  The market hit 58.40 support last night and I expect a rally of 4 to 5 dollars to develop from current levels.

December Gold: It looks like gold will not make it to 613 and instead has begun a drop to below 500.

December Silver: Silver stopped 3 cents shy of 1220 resistance and now has begun a drop to below 900.

Google:  GOOG will soon move above its all time high of 475 and be trading above 500 in a few weeks.  

Friday, October 20, 2006

Sears Holdings


Here is a highly condensed daily bar chart of Sears Holdings. I last commented on SHLD here.

The market is within 10 points of my 181 target. I think SHLD will reach 181 and maybe go a few points higher. But I also think that the next 40 point move from here will be downward

Google


Here is daily chart of Google. I last commented on GOOG here.

After yesterday's close GOOG released a very favorable earnings report. The news sent the stock a few points higher that it was on April 21, the last time such a good report was released. This gives us an unusual opportunity to compare price action at similar levels and in a similar news context.

On April 21 GOOG had traded as high as 455 on the earning's news, then opened on the Nasdaq near 450 and sold off the rest of the day. It closed April 21 near 437, about 13 points under the open and 18 points under its high for the day. Let's watch GOOG today. It traded as high as 460.71 before the open. A drop of 18 points from there would take the market to 442 or so. If GOOG can stay above that level today the market will be telling us that it is in a more bullish condition than it was on April 21 which began a 100 point break.

I think GOOG will hold up well today and will soon be trading at new bull market highs above 475.

Postscript - at 4 pm ET: GOOG closed less than a point from its high today. This is very bullish action!

Guesstimates on October 20, 8:50 am ET

December S&P Futures: Early this morning the market hit 1376.75 and since has broken about 4 points. I am still leaning on resistance at the 1376 level and expecting the market to drop to 1362 and eventually into the 1350-55 zone. In any case I expect to see a 1400 print later this year.  

December Bonds: I expect the bonds to hold support at 110-12 and then rally to resistance at 111-12. Over the next few weeks the bonds should drop into the 107-108 zone.

December 10 Year Notes: The notes are now headed down to 105-16 or so. Support today is at 106-16 while resistance is at 107-16. .

Euro-US Dollar:  The Euro has rallied to 126.42 and should move lower from there. Any strength above that level would turn me bullish. In the meantime I shall stick with my view that the market is headed down to 124.50 and eventually much lower than that.

Dollar-Yen: The yen has reached support near 118.10 and should now rally to 120.50. I shall turn short term bearish if weakness develops below 118.00. In any case I expect to see the yen at 130 next year.

December Crude:  Resistance is at 61.50 today. Strength above there would force me to abandon my short term target at 58.40. In any case I am still expecting a rally of 4 or 5 dollars from whatever low is made in the 58.00 to 60.00 zone.

December Gold: I expect the market to bounce off of resistance at 613 and then turn lower and resume its drop to below 500.

December Silver: I expect silver to bounce off of resistance near 1220 and then resume its drop below the 900 level.  

Google:  Support is at 418 and I think GOOG will soon move above its all time high of 475.  

Thursday, October 19, 2006

Chicago Merchantile Exchange


Here is a daily chart of the Chicago Merchantile Exchange. I last commented on CME here.

On the news that CME proposed to purchase the Chicago Board of Trade CME gapped up to 535 and since then has dropped 30 dollars a share. The trend is still upward in CME but I have learned to treat news events at new bull market highs which are also near my price targets with great respect. In this case I think that CME has pretty much finished its bull market advance and is probably better regarded as a short term trading vehicle than as an investment vehicle.

Board of Trade


Here is a daily bar chart of the Chicago Board of Traded. I last commented on BOT here.

As you can see the market gapped past the 148 target on the news of the proposed purchase of BOT by the Chicago Merchantile Exchange. At this point I am going to cease my coverage of BOT.

S&P


Here is an hourly chart of the December S&P e-mini futures. I last commented on this market here.

I don't have anything new to say; the market has been locked in at 1369-76 trading range for the better part of two days. I still think the odds favor a drop to 1362 before a rally to 1386, but if the market shows strength above 1376 I shall turn short term bullish once more.

Gold


Here is an hourly chart showing pit trading in December gold futures. I last commented on this market here.

Gold has rallied much more than I expected. The biggest rally on the way down from the July top has be about 50 dollars. I think that gold will equal that rally by reaching the 613 level soon. From there I expect the market to move below 500.

Crude Oil


Here is an hourly chart showing pit trading in December crude oil futures. I am switching to the December contract today which is trading about 1.70 over November. I last commented on crude oil here.

As you can see the market has bounced off of the 59.00 level three times so far, and the first two rallies ended at lower tops. I think this third rally will also end at a lower top, probably near the 60.30 level. Then I shall look for a brief drop to new lows near 58.40. This should be followed by and extended rally of 4 or 5 dollars.

Guesstimates on October 19, 8:50 am ET

December S&P Futures: I am leaning on the 1376 level and expecting the market to drop to 1362 and eventually into the 1350-55 zones. In any case I expect to see a 1400 print later this year.  

December Bonds: I expect the bonds to hold support at 110-12 and then rally to resistance at 111-12. Over the next few weeks the bonds should drop into the 107-108 zone.

December 10 Year Notes: The notes are now headed down to 105-16 or so. Support today is at 106-16 while resistance is at 107-16. .

Euro-US Dollar:  I think that the market is headed down to 124.50 and eventually much lower than that. Resistance today is again at 125.95.

Dollar-Yen: The yen should find support near 118.10 and then rally to 120.50. I expect to see the yen at 130 next year.

December Crude:  Switching to the December contract today which trades 1.70 over November. The 58.40 level is now support and from there I am looking for a 4 or 5 dollar rally.

December Gold: I expect the market to turn lower from there and resume its drop to below 500.

December Silver: Silver should resume its drop to below the 900 level.  

Google:  Support is at 418 and I think GOOG will soon move above its all time high of 475.  

Wednesday, October 18, 2006

Crude Oil


Here is an hourly chart showing pit and electronic trading in November crude oil. I last commented on this market here.

The market has not been as strong as I expected but I still think a rally of 4 or 5 dollars is likely to begin from a slightly lower low near 56.50.

December S&P Futures

S&P Note

Here is a 5 minute chart of the December S&P futures. I last commented on this chart here.

I still think the market is on its way down to 1362 or so from today's high at 1380.25. I am leaning against the 1375.75 rally high made earlier today. If that level is exceeded in a significant way I shall start looking for a move up to 1386 or so.

In the mean time note that the rally from the low today at 1367.75 as matched the mid-day rally in length so I doubt that the market will make it as high as 1375 before turning lower again.

S&P Second Update


A short while after my last post the market contradicted my conlusions by accelerating below the 1370 level. Now the S&P's are headed down to 1362 and probably to 1353 after that.

S&P Update


Here is an updated 5 minute bar chart of the December S&P e-mini futures. I commented on this chart earlier today.

The market rallied to 1375.75 from the day's low so far at 1370.00. I then expected a drop below 1370 in fairly quickly. Instead the S&P's have since dropped 4 points from 1375.75 in the same amount of time that it took the market to drop 10 points this morning.

This action makes me suspicious. It is an example of a dog that isn't barking, i.e of the market not behaving as it normally does if it was soon to drop to 1364.

Here is another comparison that makes me suspicious. Note that the break from Friday's high at 1378.25 was fast and carried 15 points. The break from today's high was also fast but dropped the market only 10 points. This also is a tentative indication that the sellers in the 1375-80 range are running out of ammunition.

Since I am basically bullish on the market's underlying trend and expect to see a 1400 print later this year I now think that the market is telling me that it will hold above the 1370 level and soon rally to 1381 and possibly higher to 1387.

December S&P futures

S&P

Here is an updated 5 minute bar chart of the S&P futures upon which I commented earlier this morning.

As you can see the market has broken decisively below the 1374 level and this tells me that it is headed for 1364 or lower. In the meantime I think a rally to 1375 or so would be normal within such a downtrend.

December S&P Futures

S&P Breakout ?

Here is a 5 minute bar chart of the December S&P e-mini futures. I last commented on this market here.

The problem I face this morning is determining whether the market will make a top near 1381 and then drop to 1364 or so as I am expecting, or whether instead we are seeing a breakout in the market which would then carry to 1390 or so.

The best guide in these circumstances is the size of reactions. The biggest reaction on the way up from yesterday's low at 1364 was 4 points. So my initial guess for the reaction which started from this morning's high at 1380.25 is 4 points, or down to 1376 or so. But the S&P's took only 20 minutes to reach 1376, less time than a normal small reaction which generally takes 30-60 minutes, so I revised my estimate for the initial reaction to 1374 or so, just a tad below yesterday's high print.

From 1374 or so the futures will probably rally to 1381-82 and from there begin a 15-20 point drop. Strength above 1382 will tell me that 1390 lies dead ahead. Weakness below 1374 will tell me that the market is headed for 1364 again.

Guesstimates on October 18, 8:50 am ET

December S&P Futures: I now think the market will rally to 1381 and then drop back close to yesterday’s low at 1364. I still think it likely that a bigger drop to 1350-55 will develop soon. In any case I expect to see a 1400 print later this year.  

December Bonds: Resistance above the market is at 111-12 and support below the market is at 109-28. The bonds are now headed down into the 107-108 area.

December 10 Year Notes: The notes are now headed down to 105-16 or so. Support today is at 106-16 while resistance is at 107-16. .

Euro-US Dollar:  I think that the market is headed down to 124.50 and eventually much lower than that. Resistance today is again at 125.60.

Dollar-Yen: It looks like the yen has begun a corrective move that should carry down to 118.10 or so. I expect to see the yen at 130 next year.

November Crude:  the 58.50 level is support and the next upswing should carry into the 61.00-61.50 range. Moreover I think a bigger rally is also underway and will carry the market into the 64.00-65.00 range.

December Gold: Resistance is at 597. I expect the market to turn lower from there and resume its drop to below 500.

December Silver: Resistance today is at 1190. From there silver should resume its drop to below the 900 level.  

Google:  Support is at 418 and I think GOOG will soon move above its all time high of 475.  

Tuesday, October 17, 2006

S&P Note

The December S&P's just printed 1373.50. Here is my last comment on this market.

I hadn't expected the market to trade above today's open at 1372. I think this means that the S&P's are headed up to 1376. But I still think that the market is in the process of trading sideways and that another drop to 1364 and more probably to 1350-55 lies ahead.

T-bond Update


Here is an hourly chart of the December T-bond futures. I commented on this market earlier today.

I think the bonds will find support tomorrow near 110-12 and then embark on the third upward phase of the correction which started from the low at 110-07. This should carry the market upward to 111-12 and be followed by a break to 109-28 or so.

S&P - Second Update


Here is an hourly chart of the December S&P e-mini futures. I last commented on this market here.

The market has rallied as high as 1370.75 so far from today's low at 1364. I think we'll see a print in the 1371-72 range followed by a drop to or a bit below today's low.

However, I do not think the market will go straight down to 1351. Instead I expect another rally from the 1360-65 range back to 1370 or so.

S&P Update


Here is an hourly chart of the December S&P e-mini futures. I commented on this market earlier this morning.

The S&P's dropped to 1364 and are now rallying. I think the market can get up to 1371 or so before another break develops. Over the next few days I think the S&P's will drop into the 1350-55 range.

Gold


Here is an hourly chart showing pit and electronic trading in December gold futures. I last commented on this market here.

I think the rally from the recent 563 low is over. The market has just dropped an amount equal to its last two reactions on the way up from 563. So I would expect it now to rally to 595 or so. But after this small rally much lower prices lay ahead.

T-bonds


Here is an hourly chart of December T-bond futures. I last commented on this marke here.

The rally has been stronger than I anticipated. I now think it will stop near 111-12, making it as big as the last rally in early October. Then we should see a drop to 109-28.

S&P


Here is an hourly chart of the December S&P e-mini futures. I last commented on this market yesterday.

The market has dropped past the 1369-70 support zone I mentioned in this morning's guesstimate. I now think it will continue down to 1365 or so. At that point the drop from yesterday's high will roughly equal the size of the last reaction from 1363.25 to 1351.

From 1365 I shall expect a rally of 7-10 points followed by the rest of the correction down into the 1350-55 zone.

Guesstimates on October 17, 8:50 am ET

December S&P Futures: I think yesterday’s 1378.25 high will hold for the rest of the week. The market will probably bounce from 1369-70 but should go no higher than 1376, yesterday’s close. I think the S&P’s have begun a drop into the 1350-55 range. I expect to see a 1400 print later this year.  

December Bonds: Resistance above the market is at 110-28 and support below the market is at 109-28. The bonds are now headed down into the 107-108 area.

December 10 Year Notes: The notes are now headed down to 105-16 or so. Support today is a t106-16.

Euro-US Dollar:  I think that the market is headed down to 124.50 and eventually much lower than that. Resistance today is again at 125.60.

Dollar-Yen: It looks like the yen has begun a corrective move that should carry down to 118.10 or so. I expect to see the yen at 130 next year.

November Crude:  The 61.00 level should be temporary resistance but I think a bigger rally is underway and will carry the market into the 64.00-65.00 range.

December Gold: Resistance is at 599. I expect the market to turn lower from there and resume its drop to below 500.

December Silver: Resistance today is at 11203. From there silver should resume its drop to below the 900 level.  

Google:  Support is at 418 and I think GOOG will soon move above its all time high of 475.  

Monday, October 16, 2006

IBM


Here is a weekly chart of IBM. I last commented on this stock in March.

My view remains unchanged. I still think IBM will make it pretty close to 100 before a significant selloff starts.

T-bonds


Here is an hourly chart of December T-bond futures. I last commented on this market here.

I think the market is in the process of developing support for a second phase rally within a three phase drop from 113-11 down into the 107-108 range. I think the market will rally up to 110-28 or so, then drop to 109-28 and then begin a bigger rally.

S&P


Here is an hourly chart of the December S&P e-mini futures. I last commented on this market Friday.

I haven't yet seen a rejection of the 1375 level so I am expecting a little bit more of a rally into the 1378-79 zone today. Then my best guess is that a three phase corrective move will begin and within a few days carry the market down near its last significant low at 1351.

Guesstimates on October 16, 8:50 am ET

December S&P Futures: The market has yet to reject Friday’s high at 1374.75 so I think that a move to 1378-79 is likely before a drop into the 1350-55 range develops. I expect to see a 1400 print later this year.

December Bonds: Resistance above the market is at 110-28 and support below the market is at 109-28. The bonds are now headed down into the 107-108 area.

December 10 Year Notes: The notes are now headed down to 105-16 or so. Support today is at 106-16.

Euro-US Dollar: I think that the market is headed down to 124.50 and eventually much lower than that. Resistance today is at 125.60.

Dollar-Yen: Support today is at 119.10. I think the yen will rally a little more, say to 120.50, before a reaction of 150-200 pips starts. I expect to see the yen at 130 next year.

November Crude: Support today is at 58.20. The next step up should carry the market to 61.00. I think a bigger rally into the 64.00-65.00 range is underway.

December Gold: Resistance is at 599. I expect the market to turn lower from there and resume its drop to below 500.

December Silver: Resistance is at 1190. From there silver should resume its drop to below the 900 level.

Google: Support is at 410 and I think GOOG will soon move above its all time high of 475.

Friday, October 13, 2006

S&P


Here is an hourly chart of the December S&P e-mini futures. I last commented on this market here.

A couple of minutes ago the market printed 1372.50. I think it can rally a little more, say into the 1373-75 zone. In any event the next swing should be downward to 1363 or so. This should be the first part of a drop next week which will carry the S&P's down to 1350 or so.

New York Stock Exchange Group


Here is a daily chart of the New York Stock Exchange Group. I last commented on NYX here.

I still expect NYX to advance to the 103 level before its bull market ends.

Board of Trade


Here is a daily chart of the Chicago Board of Traded. I last commented on BOT here.

I still think BOT will make it to 148. As with CME I think this is a conservative target and a stronger move up to 165 or so would not surprise me.

CME


Here is a daily chart of the Chicago Merchantile Exchange. I last commented on CME here.

I still think CME is on it way to 541 and if I turn out to be wrong it will be because it continues further to 560.

Guesstimates on October 13, 8:50 am ET

December S&P Futures: The S&P’s are about to establish another 10 point trading range with its high near 1373. The odds favor a break of 25-30 points next week. I expect to see a 1400 print later this year.  

December Bonds: Resistance above the market is at 111-04. The bonds are now headed down into the 107-108 area.

December 10 Year Notes: The notes are now headed down to 105-16 or so.

Euro-US Dollar:  I think that the market is headed down to 124.50 and eventually much lower than that. Resistance today is at 126.25.

Dollar-Yen: I think the yen will rally a little more, say to 120.50, before a reaction of 150-200 pips starts. I expect to see the yen at 130 next year.

November Crude:  The market should rally quickly above the 59.00 level and if it does it should continue upward into the 64.00-65.00 range.  Failing this I shall change my mind about and imminent rally and instead look for a drop to 53.00.

December Gold: Resistance is at 591. I expect the market to turn lower from there and resume its drop to below 500.

December Silver: Resistance is at 1170. From there silver should resume its drop to below the 900 level.  

Google:  Support is at 410 and I think GOOG will soon move above its all time high of 475.  

Thursday, October 12, 2006


November Crude Oil

Crude Oil

Here is an hourly chart showing pit and electronic trading in November crude oil futures. I last commented on this market here.

I still think this market is about to rally into the 64.00-65.00 range. If I am right then crude oil should climb above 59.00 in a day or two and stay there.

S&P Update


Here is an hourly chart of the December S&P e-mini futures. I commented on this market earlier today.

The S&P's are approaching the 1373 target. I still think that a break of 25-30 points is likely to start from there. But first I think we shall see a move down to support near 1363 followed by another move above 1370.

I must point out that this market shows little volatility as it continues to advance. This is a very bullish sign. It meanst that skepticism dominates traders' thinking, not enthusiasm. In such circumstances the market's trend will continue to develop in a pattern of higher lows and higher highs until volatility shows an obvious increase.

S&P Bull Market Boxes


Here is a weekly chart of the cash S&P 500 index. I last commented on this chart here.

On this chart I have drawn the bull market boxes that I have been using for this index over the past 3 1/2 years. These boxes are 186 points high, equal to the first big rally from the October 2002 low.

The midpoint of the current boxe is 1418. This is my target for the current rally in the S&P cash and the futures will probably trade 5-10 points higher. I think these levels will be reached by the end of November.