Monday, October 31, 2005

Gold


Here is an hourly chart of pit and electronic trading in December gold futures. One of my general rules is that lower tops are followed by lower lows. In this case gold has rolled over before moving above its 382 top so I expect this reaction to carry down to 361 or so before the market turns up once again.

I think we will see the 500 level in a few weeks.

Google


Here is an updated daily chart of Google. Several months ago I calculated a bull market target for GOOG of 376 and we are nearly there. Still, there is no sign of a top as GOOG is still outperforming the market averages. My best guess now is that this stock will continue upward into the 425-475 range.

Three Peaks and a Domed House


For the past two years I have been following the development of several potential examples of Lindsay's Three Peaks and a Domed House formation in the Dow Industrials and the S&P 500. You can find my last post on the subject here and here is an index of all of my Lindsay posts.

The first chart above this post shows the ideal model of the Three Peaks and a Domed House. The second chart is a weekly chart of the Dow industrials on which I have labeled three evolving examples of the 3PDH with black, red and blue numerals to show the correspondence with the model formation.

In the Dow the first two three peaks formations started in February 2004. The first of these is labeled by black numerals. At this juncture I see two problems with this interpretation. The main one is that it has gone on too long (almost 2 years) with no domed house in sight. The typical major example of a 3PDH lasts a little less than two years from start to finish. The other problem with this interpretation is that there is no obvious point 14. For these two reasons I no longer have much confidence in the 3PDH labeled by the black numerals.

The 3PDH labled by the red numerals does have a clearly defined point 14 (in May 2005) and Lindsay's time measurement from there predicts a top for late December 2005. This formation is still viable in my view but it too has lasted longer that the typical 3PDH.

The formation labeled by blue numerals started in January 2005 is now my favored interpretation. If it lasts about 2 years from start to finish the drop from the domed house peak would end in late 2006 or early 2007, right in line with my 2005 stock market forecast prediction. The blue formation has also just completed a classic point 14 at the October 28 intraday low. Adding 7 months 10 days to this predicts a top for the domed house on May 8, 2006.

(Added on July 31, 2006: This calculation is wrong - I should have said that adding 7 months and 10 days to October 28 gives June 8 as the predicted date for the top of the domed house. Of course, as it turned out, the domed house peak in fact occurred on May 5, just 3 days before my accidently correct prediction. This shows that sometimes it is better to be lucky than it is to be good.)

This would end the entire advance from the October 2002 low and in my view the subsequent drop would probably carry the averages down 20 to 25%.

Guesstimates on October 31, 8:50 am ET

December S&P Futures: The market is headed for 1223 and eventually to 1350.

December Bonds: A close today below 113-11 will confirm that the longer term trend in the bonds has turned downward. Resistance above the market now is at 112-16.

December 10 Year Notes: A close below 109-02 today will mean that the longer term trend has turned downward.  Resistance above the market is at 108-24.

December Eurocurrency: The has stalled at 121.80 resistance and is now on its way to my 117.50 to 118.50 target area.

December Crude: The 63.30 level is still resistance but it now looks like the market is headed for the next downside target at 57.90. The market should be trading below 56.00 soon.

December Gold: The market is now headed for 500.  

Google: Has reached the short term  target at 352 and support is now at 334.  Next short term upside target is 369.

Friday, October 28, 2005


Daily Advancing Issues on the New York Stock Exchange

Hourly Chart of December S&P Futures

S&P

As you can see in the updated hourly chart above the December S&P futures bounced off the bottom of the box at 1180 and I think the next stop will be 1223. I believe the market is in the early stage of a move which will carry to 1350 over the next few months.

In the second chart above you can see that the daily count of the NYSE advancing issues is maintaining its bullish configuration. I last commented on these numbers here.

Guesstimates on October 28, 8:50 am ET

December S&P Futures: The market reached the bottom of the box at 1180 overnight and now I am looking for a move up to 1223 and eventually to 1350.

December Bonds: A close on Monday below 113-11 will mean that the longer term trend in the bonds has turned downward and that my long standing 121-123 target will not be reached for a couple of years. Resistance above the market now is at 112-16.

December 10 Year Notes: A close below 109-02 Monday will mean that the longer term trend has turned downward.  Meantime resistance above the market is at 108-24.

December Eurocurrency: The market is stalling at 121.80 resistance. The most likely event now is a drop to my 117.50 to 118.50 target area.

December Crude: The 63.30 level is still resistance but it now looks like the market is headed for the next downside target at 57.90. The market should be trading below 56.00 soon.

December Gold: The market’s has held support at 463 and is now probably headed for 500.  

Google: Has reached the short term  target at 352 and support is now at 334.  Next short term upside target is 369.

Thursday, October 27, 2005

S&P


As you can see the December S&P futures have reached support at 1186. There is some chance that the market is going to continue down to the bottom of the box at 1180 but even then I think the next big swing will be upward to 1223.

Gold


Here is an updated hourly chart of pit and electronic trading in December gold.

As you can see the market bounced off of support at 464 and I think it now is on the way to 500. The ultimate bull market top is not far away. I estimate that it will occur around the 520 level.

A Longer Term Look at the Bonds


Here is a daily chart of the December t-bond futures.

As I said yesterday a month-end close below the August low (blue line) will mean that the longer term trend in the bonds turned downward from the June 3 top which, in the September 2005 contract, occurred at 119-23. Right now my best guess is that the market will close below 113-11 on October 31.

I have drawn what I think are the boxes which will control the drop from 119-23. My best guess now is that the market will drop into the 106-108 range and make a very important low there sometime during the second half of 2006.

My estimate is based on two factors. First, the market never made it into my 121-123 target range and this tells me that it is likely to make a low above the May 2004 low at 103-02. Second, I use a rule of thumb that says that when the market is in a trading range swings within that range typically reverse only when the upper or lower 1/3 of the range has been reached. In this case I would take the range to be 103-120 and this suggests that the bonds would have to drop below 108-20 before we could start looking for a reversal of the downtrend from 119-23.

There is a box low at 108-00 and the 1/2 point of the next box down is 106-02 so I think one of these two points will probably mark the low I expect to see next year.

Guesstimates on October 27, 8:50 am ET

December S&P Futures: Support is at 1186 while the next upside target is now 1223. I think the market has started a move to 1350.

December Bonds: A close on Monday below 113-11 will mean that the longer term trend in the bonds has turned downward and that my long standing 121-123 target will not be reached for a couple of years. Resistance above the market now is at 112-16.

December 10 Year Notes: A close below 109-02 Monday will mean that the longer term trend has turned downward.  Meantime resistance above the market is at 108-24.

December Eurocurrency: The market is trying to break above 121.80 resistance this morning. If it succeeds a big rally is likely to ensue.

December Crude: The 63.30 level is still resistance but it now looks like the market is headed for the next downside target at 57.90. The market should be trading below 56.00 soon.

December Gold: The market’s has held support at 463 and is now probably headed for 500.  

Google: Has reached the short term  target at 352 and support is now at 334.  I  think Google will trade well over 360 before its bull market is done.

Wednesday, October 26, 2005

Eurocurrency


Here is a daily chart of pit trading in the December eurocurrency futures.

The market has been trading below the top of the current blue box for two weeks and I still think it likely that it will drop near the bottom of its current red and blue boxes (around 118 or so) before a bit rally can begin.

Crude Oil


Here is an updated hourly chart showing pit and electronic trading in December crude oil.

I had been expecting the market to reach 63.30 on the rally but it only made it to 62.95 this morning before reversing decisively. I think it is now headed for 57.90.

Bonds and Notes


Here are updated daily charts of the December t-bond futures and 10 year note futures.

My working hypothesis all year has been that these markets made lows in May 2004 and have not yet seen their highs for the move up that started then.

But there comes a time when the market's action contradicts any hypothesis. In this situation I have been regarding a monthly close below the August '05 lows as reason to abandon my longer term bullish views which were expressed in my 2005 bond forecast.

The break during the past three days makes a close on October 31 below the August '05 lows very likely. Such a close will mean that the notes are headed down to 102 or so. The bonds may well stay above their May 2004 lows but will probably drop at least to 107 or so. These low points will probably occur during the second half of 2006.

Guesstimates on October 26, 8:50 am ET

December S&P Futures: Next resistance above the market is 1213 while support is now at 1186. I think the market has started a move to 1350.

December Bonds: The bonds should hold support at 111-30 and then begin a move to 115-00. I still think this market is about to swing upward into the 121-123 range.

December 10 Year Notes: The notes should hold support near 108-14 and then begin a bit move upward.

December Eurocurrency: The 121.80 level is still resistance and the next low should be in the 117.50 to 118.50 range. After that a rally to 124 is likely.

December Crude: I think prices will reach the 63.30 level and then head down to 57.90.  The market should be trading below 56.00 soon.

December Gold: The market’s has held support at 463 and is now probably headed for 500.  

Google: Short term target is 352 and support is at 325. I still think Google will trade well over 360 before its bull market is done.

Tuesday, October 25, 2005

Bonds and Notes


Here are updated hourly charts of pit trading in the December t-bond futures and 10 year note futures.

I thought both markets would make higher lows this morning but that didn't happen. Instead both have dropped back to their recent low points. I think the bonds will halt near 112-00 and the notes near 118-14. I think this is the last shake out before a substantial rally begins.

Crude Oil


Here is an updated hourly chart showing pit and electronic trading in December crude oil futures.

The market has broke past resistance at 61.50 and I think it is headed higher to 63.30 before the rally ends. From there the next step down should carry to 57.90.

Baidu


Here is an updated daily chart of Baidu.com. I last commented on BIDU here.

A move to 105 is underway and I think that BIDU will probably rally at least to 135 before the bull market in the broad averages ends.

Guesstimates on October 25, 8:55 am ET

December S&P Futures: Yesterday’s late strength convinced me that 1172 was the low of the move down from 1250.  Next resistance above the market is 1213 while support is now at 1186. I think the market has started a move to 1350.

December Bonds: I expect support at 112-24 to hold the next swing upward should carry to 115-00. I think this is the start of a move into the 121-123 range.  

December 10 Year Notes: I think a move to 116 has started. Minor support is at 109-00 and next upside resistance is at 109-30.

December Eurocurrency: The 121.80 level is still resistance and the next low should be in the 117.50 to 118.50 range. After that a rally to 124 is likely.

December Crude: I still think prices are headed to 57.90 with resistance at 61.50. The market should be trading below 56.00 soon.

December Gold: The market’s has held support at 463 and is now probably headed for 500.  

Google: Short term target is 352 and support is at 325. I still think Google will trade well over 360 before its bull market is done.

Monday, October 24, 2005

Onward and Upward


After an afternoon pause the S&P futures have resumed their advance. The updated hourly chart above of the December contract now shows two consecutive higher tops and two consecutive higher lows. Combining this with the strong showing of the advancing issues number and the excessively bearish market sentiment leads me to now conclude that the October 13 low at 1172 will hold and that the market has started its rally to 1350.

S&P


Here is an updated hourly chart of pit trading in the December S&P futures. Above this post you will also see a daily chart of the number of advancing issues on the New York Stock exchange.

At the moment the number of advancing issues today is higher than for any day in the past six weeks. You can also see a succession of upward ziz-zags in the daily numbers. Together with the obvious upturn in the 10 day moving average of this indicator we have a very bullish picture developing.

Even so, you can also see that the market has stalled at a top below the last top of 1200.80 and below the 1/2 point of the current box at 1202. This makes me think that it will drop to 1159 before a sustained rally starts. Such a drop would almost certainly setup a strong bullish divergence between price and the advancing issues indicator and this, together with the extreme bearishness by short term traders would set the stage for the rally to 1350 that I am expecting.

If the market just goes straight up from here (contrary to my expectation) the advancing issues numbers will be telling us that the low at 1172 on October 13 ended the drop from 1250 and that the rally to 1350 has already begun.

Guesstimates on October 24, 8:45 am ET

December S&P Futures: The 1195 level is now resistance .  A move as high as 1206 would make it likely that the 1172 low last week ended the drop from 1250. Until then I think there is a good chance that the market will yet make it down to 1159 before the big rally I am expecting begins.

December Bonds: The bonds moved above 113-08 Friday and I think this is the start of a move into the 121-123 range.  Minor support is at 113-08 and resistance is at  114-16.

December 10 Year Notes: The notes moved above 109-11 Friday and I think a move to 116 has started. Minor support is at 109-00 and next upside resistance is at 109-30.

December Eurocurrency: The 121.80 level is still resistance and the next low should be in the 117.50 to 118.50 range. After that a rally to 124 is likely.

December Crude: I still think prices are now headed to 57.90 with resistance at 61.50. The market should be trading below 56.00 soon.

December Gold: The market’s should hold support at 463 and then rally to 492.

Google: Short term target is 352 and support is at 325. I still think Google will trade well over 360 before its bull market is done.

Friday, October 21, 2005

Board of Trade


The Chicago Board of Trade had its IPO a couple of days ago. As you can see from the hourly chart above we don't have much price history to work with. Even so, I think BOT will easily make it to my inital target of 155. After that we'll see.

CME


Here is a daily chart of CME.

I have been bullish on this stock for quite a while. Right now I think it is headed for the top of the current box at 363 and eventually to the top of the next box near 430.

Baidu


I have been bullish on Baidu.com ever since its IPO. But, at least so far, I have been wrong about its price trend even though BIDU is now trading at 2 1/2 times its IPO price of 27.

Above you will see a daily chart of BIDU on which I have drawn some divisions of its historical range from 60 to 154.

I think BIDU is about to rally with the rest of the market. My minimum expectation is the 1/2 point of its range around 105. However, if enthusiasm builds as is likely during a general stock market advance, a move to 132 or so would be more likely.

Google


Google reported a big earnings increase yesterday and the stock reached a new bull market high at 346 in early trading today. I have been bullish on GOOG ever since its IPO. My bull market target has been 376 but frankly I think this is too conservative, especially since I think the bull market in the broader averages is not yet complete. So I am guessing that GOOG will hit 450 or so during the next six months.

Bonds and Notes


As you can see from the hourly charts above this post, both the December t-bond and 10 year notes futures have accelerated above the top of the recent trading range. I think this is the start of a move which will carry the bonds into the 121-123 range and the notes to 116.

Stock Market Bears

Take a look at this column on Marketwatch by Mark Hulbert. His measurements indicate that the bearish sentiment shown by short term market timers exceeds even the levels attained at the 2002 lows in the US stock market and is at its most bearish reading in six years! And Nasdaq timers are even more bearish than this!

This simply amazes me. How can so many be so emphatically bearish when the S&P 500 is so close to its 2005 highs? More importantly, how can they possibly be right? You know my answer to the last question - they can't be right. And a big rally to new bull market highs is just ahead of us.

Along the same lines take a look at this column by Floyd Norris in today's New York Times business section. (Sad to say, you won't be able to access it without being a subscriber!). He observes that there is a remarkable amount of pessismism out there on the part of U.S. money managers and corporate excutives. Even consumers think that the next 6 months will be bad for the economy.

Both Hulbert and Norris give us evidence to back up the readings of the Rydex cash flow index which I last discussed here.

I think this situation will go down in the annals of contrary opinion as a classic case of heavy bearish sentiment completely unjustified by current events and eventually contradicted by a huge subsequent upmove.

Guesstimates on October 21, 9:00 am ET

December S&P Futures: The 1195 level is now resistance . A move as high as 1206 would make it likely that the 1172 low last week ended the drop from 1250. Until then I think there is a good chance that the market will yet make it down to 1159 before the big rally I am expecting begins.

December Bonds: The bonds are holding above the 112-00 to 112-08 support zone. Minor resistance is at 113-08 and strength above that level would be very bullish. I still think a strong rally into the 121-123 range will start soon.

December 10 Year Notes: The last minor top was at 109-11 and strength above that level would be very bullish. I think a big rally lies just ahead.

December Eurocurrency: The 121.80 level is still resistance and the next low should be in the 117.50 to 118.50 range. After that a rally to 124 is likely.

December Crude: I think prices are now headed to 57.90 with resistance at 61.50. The market should be trading below 56.00 soon.

December Gold: The market’s should hold support at 463 and then rally to 492.

Google: GOOG moved above 320 on yesterday’s earnings news. I am raising my short term target to 352 from 343. I still think Google will trade well over 360 before its bull market is done.

Thursday, October 20, 2005

Gold


December gold has reached 463 support and I think the next move will be upward to 492.

S&P


It looks like the December S&P futures have bounced off of 1199 resistance this morning. If I am reading the market correctly the next swing should be downward to 1159. That should mark the end of the drop from 1250.

Guesstimates on October 20, 8:50 am ET

December S&P Futures: The 1199 level is still resistance .  A move as high as 1206 would make it likely that the 1172 low last week ended the drop from 1250. Until then I think there is a good chance that the market will yet make it down to 1159 before the big rally I am expecting begins.

December Bonds: The bonds are holding above the 112-00 to 112-08 support zone.  Minor resistance is at 113-08 and strength above that level would be very bullish. I still think a strong rally into the 121-123 range will start soon.

December 10 Year Notes: The last minor top was at  109-11 and strength above that level would be very bullish. I think a big rally lies just ahead.  

December Eurocurrency: The 121.80 level is still resistance and the next low should be in the 117.50 to 118.50 range. After that a rally to 124 is likely.

December Crude: I still think prices are now headed to 59.00.

December Gold: The market’s should hold support at 463 and then rally to 492.

Google: Support is now at 292. The bull market in GOOG is far from over and a move above 320 will be the next big development.  

Wednesday, October 19, 2005

Advancing Issues


I like to watch the behavior of the number of issues traded on the New York Stock Exchange that advance in price each day. This number together with its 10 day moving average often provides early warnings of changes in trend.

The daily chart above shows the number of NYSE advancing issues and its 10 day moving average (in red). You can see that the daily number has made three higher lows, the second of which coincided with last week's low at 1172 in the S&P futures. The 10 day moving avergage has also turned upward. I think the stage is being set for an important divergence if the S&P futures drop to 1159 but the daily and 10 day moving averages stay above their recent lows. Such a divergence would be a very bullish indication. Coupled with the very bearish short term trading sentiment it would indicate a big rally just ahead.

Eurocurrency


Here is an updated hourly chart showing pit and electronic trading in the December eurocurrency.

I still think the market will make it into the 117.50 to 118.50 range before beginning a strong rally. The July 8 low in the September contract was 119.00 so this morning's rally from the 119.14 level reflects the buying that usually shows up in the vicinity of old lows. 121.80 remains resistance and strength above there would mean that the market is headed back to 124.

Crude Oil


Here is an updated hourly chart of December crude oil showing both pit and electronic trading.

The market remains stuck in a short term trading range and today's lower low makes a move to my 64.40 target unlikely now. I do think today's late bounce will continue up to 62.50 but after that a drop to 59.00 will probably develop. I still expect to see the market below 56.00 in a few weeks.

S&P


As you can see from the updated hourly chart above this post the December S&P futures made a higher low this morning and higher lows are typically followed by higher highs. In this instance I expect continuation up to 1199. As I mentioned in this mornings guesstimate, if this rally should go further, say to 1206, I would conclude that last week's low at 1172 ended the drop from the 1250 high.

Guesstimates on October 19, 8:50 am ET

December S&P Futures: The 1199 level is still resistance but minor support at 1186 was broken yesterday afternoon so I have to conclude that the market is headed for the 1159 level.

December Bonds: The bonds have held the 112-00 to 112-08 support zone. Minor resistance is at 113-08 and strength above that level would be very bullish. I still think a strong rally into the 121-123 range will start soon.

December 10 Year Notes: The last minor top was at 109-11 and strength above that level would be very bullish. I think a big rally lies just ahead.

December Eurocurrency: The 121.80 level is still resistance and the next low should be in the 117.50 to 118.50 range. After that a rally to 124 is likely.

December Crude: I still think prices are headed to the 64.40 resistance level. After that the market will drop well below 60.00.

December Gold: The market’s initial bounce off of support at 468-470 didn’t hold so I am looking for a further reaction to 463 before the rally can resume. The next step up should carry to 492.

Google: Support is now at 292. The bull market in GOOG is far from over and a move above 320 will be the next big development.

Tuesday, October 18, 2005

Bonds


Here is an hourly chart of the December t-bond futures.

The market has been hit with a lot of bad news over the past few weeks and traders have been adjusting their expectations in the directions of Fed rate increases for the forseeable future.

In the face of this the market has become dead dull at the bottom of a 4 1/2 month, 7 point decline from the early June high. I think this is a bullish development and the harbringer of a rally into the 121-123 zone.

S&P


Here is an updated hourly chart of the December S&P futures.

I think that the 1186 level is minor support and that the market is about to rally to 1199. After that drop to 1159 will become likely.

Guesstimates on October 18, 8:50 am ET

December S&P Futures: My best estimate now is that the market will rally to 1199 and then drop to 1159. A move to 1206 would mean that 1172 was the low of the drop from 1250.

December Bonds: The 112-00 to 112-08 zone is support. The move down from the late August top is now as long as the initial drop from the early June top.  I still think a strong rally into the 121-123 range will start soon.

December 10 Year Notes: The108-14 level is support. I think a big rally lies just ahead.  

December Eurocurrency: The 121.80 level is still resistance and the next low should be in the 117.50 to 118.50 range. After that a rally to 124 is likely.

December Crude: Prices are headed to the 64.40 resistance level.  After that the market will drop well below 60.00. level is still resistance in the meantime.

December Gold: Support is 468-470 and the next step up should carry to 492.

Google: Support is now at 292. The bull market in GOOG is far from over and a move above 320 will be the next big development.  

Monday, October 17, 2005

Gold


Here is an hourly chart of December gold futures which shows both electronic and pit trading.

As you can see gold held the 468-470 support zone and it is now headed for the 1/2 point of the next box at 490.

The bull market in gold is rapidly approaching my long standing bull market target of 520 or so.

Eurocurrency


Here is an updated hourly chart showing pit and electronic trading in the December eurocurrency futures.

I think this market is on its way to the 117.50 to 118.50 zone from which it will mount a rally of several hundred points.

Crude Oil


Here is an updated hourly chart of pit and electronic trading in December crude oil. I think the market will reach 64.40 and then resume its drop.

Hourly Chart of December S&P Futures

S&P

Here is an updated hourly chart of the December S&P futures.

The market still has a good shot at rallying to 1199, close to the 1/2 point of the current box at 1202. If it manages to move a few points higher than that 1/2 point, say to 1206 or so I would conclude that the 1172 level reached last week was the low of the reaction from 1250.

In the meantime I think it makes sense to expect the market to stop around 1199 and then to move to the 1/2 point of the next lower box near 1159. Should the market reach 1159 in a few days a very clear divergence would probably appear in the 10 day advancing issues indicator and make it very likely that the final low has been seen.

Guesstimates on October 17, 8:55 am ET

December S&P Futures: The rally will meet resistance at the ½ point of the box near 1202. I think the odds are then better than even that the market makes it down to 1167 or so before the big rally I am expecting begins.

December Bonds: The 112-00 to 112-08 zone is support. The move down from the late August top is now as long as the initial drop from the early June top.  I still think a strong rally into the 121-123 range will start soon.

December 10 Year Notes: The108-14 level is support. I think a big rally lies just ahead.  

December Eurocurrency: The 121.80 level is still resistance and the next low should be in the 117.50 to 118.50 range. After that a rally to 124 is likely.

December Crude: Prices are headed to the 64.40 resistance level.  After that the market will drop well below 60.00. level is still resistance in the meantime.

December Gold: Support is 468-470 and the next step up should carry to 492.

Google: Support is now at 282. The bull market in GOOG is far from over and a move above 320 will be the next big development.  

Friday, October 14, 2005

Yikes !!! Bears Are Everywhere !


Here is an updated picture of the Rydex Cash Flow ratio which is calculated by Decisionpoint.com (I think the 20 dollar per month subscription is worth it just for this ratio alone, and there is much, much more available from Decisionpoint.com !)

I last commented on the ratio here.

Yesterday the ratio reached the 1.08 level. This is the highest level reached in the past 5 years. According the the Rydex cash flow ratio, traders are more bearish than they have been at any time during the 2000-2002 bear market or during the subsequent bull market.

Now I think this is a bit of an exaggeration of the true state of affairs, but it is evidence that amateur short term market timers think much lower prices are likely in the stock market averages. This makes me even more bullish than I have been recently.

Guesstimates on October 14, 8:55 am ET

December S&P Futures: The rally on this morning’s news in electronic trading is not likely to carry the market past the ½ point of the current box at 1202. I think the odds are then better than even that the market makes it down to 1167 or so before the big rally I am expecting begins.

December Bonds: The rally on this morning’s CPI news will probably carry to 113-20 or so. More than that would be very bullish. The move down from the late August top is now as long as the initial drop from the early June top. I still think a strong rally into the 121-123 range will start soon and if so the market should not drop below 112-00.

December 10 Year Notes: The notes will probably rally to 109-20 or so before stalling. I think a move to 116 has either begun or will begin not far from yesterday’s low at 108-26.

December Eurocurrency: The 121.80 level is still resistance and the next low should be in the 117.50 to 118.50 range. After that a rally to 124 is likely.

November Crude: Prices are headed down to 57.50. The 64.40 level is still resistance in the meantime.

December Gold: Support is 468-470 and the next step up should carry to 492.

Google: Support is now at 282. The bull market in GOOG is far from over and a move above 320 will be the next big development.

Thursday, October 13, 2005

NYSE Advancing Issues


Last week I commented on what I thought was an emerging divergence in the advancing issues numbers which would have indicated that a low was at hand. As you can see in the chart above the potential divergence in the 10 day moving average of this number was eliminated today as it fell to the level reached in March of this year. The daily numbers are still showing a small divergence but I don't like to rely on them alone.

Right now I think we have seen the worst of the daily numbers and another low tomorrow around 1167 in the S&P accompanied by a daily number of advancing issues above today's level of 1156 would be a very bullish indication.

Looking further ahead, there is a 50-50 chance that after a 30 point rally in the S&P we will see somewhat lower lows which will be accompanied by higher readings in the 10 day moving average. If this occurs it will be an extremely bullish indication but in my experience only about half of the important low points in the averages are accompanied by this sort of divergence, so we can't count on it.

Bonds


I had thought that the August 8 low ended the reaction from the June 3 top in the bond market.

As you can see from the daily chart of the December bond futures above I was completely wrong about this. The question now is whether or not a new bear market has started.

My 2005 bond market forecast had predicted a top for August 2005 and a drop into late 2006. So far the market's top occurred on June 3 making the bull market from the May 2004 low barely 12 months in length. The last three bull markets lasted 18 months (April 1997- October 1998), 22 months (January 2000 - November 2001) and 15 months (March 2002 - June 2003).

This is one reason why I think my "up to 121-123" forecast still has a good chance of bearing fruit. The other is that very few people see any chance of a sustained rally in bond prices from here given the unfriendly stance of the Fed.

In any event, I think the market is at a juncture which will soon tell me whether my bullish view can be sustained.

On the chart I have drawn boxes for the drop from the June 3 top in red. The bottom of the current box is at 111-30. Moreover, at 112-10 the drop from the post Katrina top at 118-10 will equal the length of the June-August drop. So I think that the rally I have been expecting will have to begin from around these levels. If it does it will give the entire drop from the June 3 top the appearance of a "zig-zag" downward which is quite standard for corrective trends within bull markets.

Any significant weakness below the 112 level will be evidence that the rally into the 121-123 zone that I have been expecting will not occur until the next bull market begins.

Eurocurrency


Here is a daily chart of the December eurocurrency. I think the market is headed down to roughly 118.00 where it will encounter the bottom of its current bear market box as well as the bottom of the box (in blue) which is controlling the drop from the post-Katrina high.

Gold


Here is an updated hourly chart of pit trading in December gold. The last two reactions were 12-14 dollars, about a box size. I think the current reaction will be about the same so I expect gold to find support in the 468-470 zone, near the bottom of the current box. After that look for a move to 488-490.

Guesstimates on October 13, 8:45 am ET

December S&P Futures: The market is trading a little below the bottom of its box at 1180 as I write this.  My best estimate for the actual low was 1178 and it that doesn’t work out I think the market will break the London bombing low at 1167 by a couple of points and then rally strongly. In any case a sustained rally to new bull market highs will start soon

December Bonds: The interest rate markets continue to be much weaker than I have been expecting. The move down from the late August top is now as long as the initial drop from the early June top.  I still think a strong will start soon and if so the market should not drop below 112-00.

December 10 Year Notes: The August 8 low at 109-02 was broken this morning. I think this breakdown is temporary and that a strong rally will soon begin.

December Eurocurrency: The 121.80 level is resistance and the next low should be in the 117.50 to 118.50 range. After that a rally to 124 is likely.

November Crude: Prices should reach 64.40 resistance today and then resume its drop to 55.50.

December Gold: Headed for short term resistance at 488. Support is at 466.

Google: 300 is support; upside target is 343.  

Wednesday, October 12, 2005

S&P


Here is an updated chart of pit trading in the S&P futures.

The low so far today is 1177.60 and I think the market is about to start a rally of 20-30 points which will prove to be the initial phase of a move to new bull market highs.

Rydex Cash Flows


I like to track short term market sentiment in the US stock market using the Rydex cash flow ratio calculated by Decisionpoint.com. This ratio records the daily value of cash flows into the Rydex family of funds money market funds and bear funds divided by the cash flow into the bull funds. I find it a very useful intermediate term indicator of market sentiment since it gives a good idea of what speculators think the market is likely to do over the next few months.

A chart of this ratio appears above. The blue line records the daily values of the ratio while the red line is an exponential moving average of that number. The scale on the chart is inverted so that high values of the ratio show up low in the chart.

During the past 4 years every time the ratio rose above 0.98 a big rally began within a couple of days. Currently the ratio is at 0.99 and this is one reason why I think a big rally is about to start.

Guesstimates on October 12, 8:50 am ET

December S&P Futures: The market is on its way to the bottom of the box at 1180 with 1178 as my best estimate for the low.  From there a sustained rally to new bull market highs will start.

December Bonds: I think a move into the 121-123 range began from Friday’s low at 103-07. Next short term resistance is at 115-04.

December 10 Year Notes: I think move up to 116 started From the August 8 low at 109-02. Next short term resistance is at 110-04.

December Eurocurrency: The 121.80 level is resistance and the next low should be in the 117.50 to 118.50 range. After that a rally to 124 is likely.

November Crude: Prices should reach 64.40 resistance today and then resume its drop to 55.50.

December Gold: Headed for short term resistance at 488. Support is at 466.

Google: 300 is support; upside target is 343.  

Tuesday, October 11, 2005

S&P


Here is an hourly chart of the S&P futures.

The rally late Friday had no follow through and the market is headed for the bottom of its current box at 1180. My guess is that it will drop a little below there, probably to 1178, before it rallies again. There is an outside chance that the 1167 level (the London bombing low) will be reached or even broken a bit, but that is the worst I can see on the downside.

Looking at the bigger picture, I think that Friday's late rally was the intial stage of "base building" and that the stage is beging set for a rally which will take the market above 1300 over the next few months.

Eurocurrency


Here is an updated hourly chart of the December eurocurrency. I still think the market is headed for the 118.00 level plus or minus 50 points. From there we should see a rally at least to 124.00.

Crude Oil


I am switching to the December contract for crude oil. You will find an updated hourly chart above this post.

In this morning's guesstimate I said that the November contract should hit 63.3o but December trades about 50 cents under November so this would correspond to 62.80 in the December contract. You can see that the market has moved visibly above that level so now I think it will continue up to the top of the current box near 64.40.

After that the bear market in crude should carry prices down to 55.50.

Guesstimates on October 11, 8:50 am ET

December S&P Futures: The market did the opposite of what I expected yesterday and now appears on its way to the bottom of the box at 1180.  From there a sustained rally to new bull market highs will start.

December Bonds: I think a move into the 121-123 range began from Friday’s low at 103-07. Next short term resistance is at 115-04.

December 10 Year Notes: I think move up to 116 started From the August 8 low at 109-02. Next short term resistance is at 110-04.

December Eurocurrency: The 121.80 level is resistance and the next step down should carry into the 117.50 to 118.20 range. After the next low a rally to 124 is likely.

November Crude: Prices should reach 63.30 resistance today and then resume its drop to 55.50.

December Gold: Headed for short term resistance at 488. Support is at 466.

Google: 300 is support; upside target is 343.  

Monday, October 10, 2005

Guesstimates on October 10, 9:10 am ET

December S&P Futures: The rally from 1186 will probably reach 1211 before any drop to the bottom of the box at 1180 develops.  Strength above 1211 will convince me that 1186 was the reaction low.  In any case I expect a move well above 1250 to be the next big development.

December Bonds: Closed today but I think a move into the 121-123 range began from Friday’s low at 103-07. Next short term resistance is at 115-04.

December 10 Year Notes: Closed today but I think move up to 116 started From the August 8 low at 109-02. Next short term resistance is at 110-04.

December Eurocurrency: The 121.80 level is resistance and the next step down should carry into the 117.50 to 118.20 range. After the next low a rally to 124 is likely.

November Crude: Prices should reach 60.00 today or tomorrow but the market shouldn’t rally above 63.00 before it resumes its drop to 55.50.

December Gold: Headed for short term resistance at 488. Support is at 466.

Google: 300 is support; upside target is 343.  

Friday, October 07, 2005


Lindsay's Basic Advances and Basic Declines in the Dow

Lindsay Looks at the Dow

The foundation of George Lindsay's stock market timing methods is his theory of Basic Advances and Basic declines. These are periods of time, measured in calendar days, that show up time and again when calculating the duration of bull and bear markets in the US stock market averages. You can read about this in Lindsay's article "Counts from the Middle Section" which is reprinted in the booklet "Selected Articles by the Late George Lindsay", published by Investor's Intelligence in New Rochelle NY 10801, USA.

Here is a monthly chart of the Dow Industrials which shows my best estimate of the terminal points of these basic advances and declines in the Dow over the past 7 years.

The basic low on September 1, 1998 started a subnormal basic advance which lasted 500 days and ended at the Dow's all time high at 11750 on January 14, 2000. The preceeding basic advance ended on August 7, 1997 and was an extended one lasting 987 calendar days. Lindsay's theory was that very long advances are followed by very short ones and vice versa, so that "everything comes out even in the end". The 1998-2000 basic advance was very short as it should have been according to Lindsay's theory.

The 2000-2oo2 bear market in the Dow developed as two long, basic declines in succession. These were separated by a two month rally from April 4 to May 22, 2001.

The second basic decline of the bear market ended on July 24, 2002. According to Lindsay's theory of alternating lengths of advances the basic advance from July 24, 2002 should be long or extended. I estimate that it ended at the March 7, 2005 top, giving it a duration of 957 days.

Where to from here?

As I pointed out in my 2005 stock market forecast there is a Lindsay 15 year, 3 month time period from the October 1990 low which expires in January 2006. At the very least I would expect the market to trend sideways until that period expires. But my analysis of the ongoing 
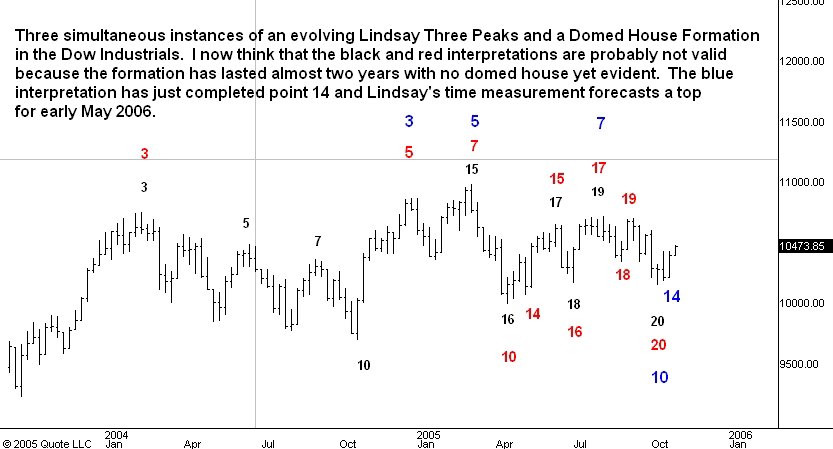
Three Peaks and a Domed House Formations says that the bull market top has not yet occurred. This conclusion is supported by another piece of evidence.

Lindsay insisted that basic advances must start once a basic decline has ended. Thus a basic advance had to begin on April 4, 2001. Where did it end? Well, it had to be a long or extended basic advance since the preceeding basic advance ending in 2000 was unusually short. So it had to last more that two years but less than three. My best guess is that it ended on January 8, 2004. This is a duration of 1009 days, 13 days longer than the longest basic advance ever recorded until then.

The subsequent basic decline ended on October 25, 2004, a duration of 291 days making it a subnormal decline. When might the top occur for the basic advance which started on October 25, 2004? If the alternation pattern continues then we should expect another subnormal basic advance. The shortest one on record lasted 14 months and the next longest ones lasted about 16 months each. So the top of the basic advance which started on October 25, 2004 should occur no sooner than late December 2005 and more probably in February or even later in 2006.

So this analysis of the sequence of basic advances and declines which had to start from the April 4, 2001 low also is telling us that the bull market top which will end the move up from the 2002 low in the Dow in 2002 has not yet occurred.

I think the final leg up in the 2000 - ? bull market lies ahead of us.

ADDED ON NOVEMBER 2, 2005: See the update to this post here.

Guesstimates on October 7, 9:10 am ET

December S&P Futures: The market dropped past the ½ division point at 1202 yesterday afternoon and so will probably halt this drop near the bottom of the box at 1180. Meantime the rally from yesterday’s low at 1186 should go no further than 1202. Next step up will be to 1268.

December Bonds: I think the August 8 low at 113-09 will be support and that a big move upward into the 121-123 range is about to start.

December 10 Year Notes: I think move up to 116 started From the August 8 low at 109-02. The notes should start moving higher from here.

December Eurocurrency: The market moved a bit above resistance at 121.80 yesterday but I think a drop to 117.50 will now begin. After the next low a rally to 124 is likely.

November Crude: Prices nearly reached 60.60 yesterday but the market shouldn’t rally above 63.00 before it drops below 60.00.

December Gold: Headed for short term resistance at 488. Support is at 466.

Google: 300 is support; upside target is 343.  

Thursday, October 06, 2005

S&P


Here is an hourly chart of the December S&P futures.

In this morning's guesstimate I said that the 1194 level was a reasonable target given that the market had yet to show any sign of slowing its drop from the 1239 high on October 3. In the event the market dropped well below 1194 this afternoon and still shows little sign of slowing its drop. From this I now conclude that the reaction low will occur near the bottom of the current box at 1180.

Meantime the S&P futures have rallied sharply from the day's low at 1186 but will have a hard time moving much above the 1/2 point of the box near 1202. I think we will see the low near 1180 tomorrow on the employment number news or early next week. Once the low occurs I will be looking for a move to new bull market highs.