
For the past two years I have been following the development of several potential examples of Lindsay's Three Peaks and a Domed House formation in the Dow Industrials and the S&P 500. You can find my last post on the subject here and here is an index of all of my Lindsay posts.
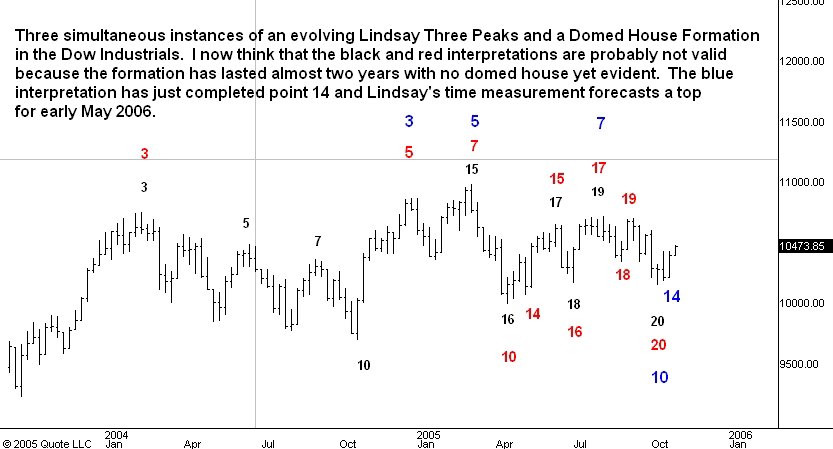
The first chart above this post shows the ideal model of the Three Peaks and a Domed House. The second chart is a weekly chart of the Dow industrials on which I have labeled three evolving examples of the 3PDH with black, red and blue numerals to show the correspondence with the model formation.
In the Dow the first two three peaks formations started in February 2004. The first of these is labeled by black numerals. At this juncture I see two problems with this interpretation. The main one is that it has gone on too long (almost 2 years) with no domed house in sight. The typical major example of a 3PDH lasts a little less than two years from start to finish. The other problem with this interpretation is that there is no obvious point 14. For these two reasons I no longer have much confidence in the 3PDH labeled by the black numerals.
The 3PDH labled by the red numerals does have a clearly defined point 14 (in May 2005) and Lindsay's time measurement from there predicts a top for late December 2005. This formation is still viable in my view but it too has lasted longer that the typical 3PDH.
The formation labeled by blue numerals started in January 2005 is now my favored interpretation. If it lasts about 2 years from start to finish the drop from the domed house peak would end in late 2006 or early 2007, right in line with my 2005 stock market forecast prediction. The blue formation has also just completed a classic point 14 at the October 28 intraday low. Adding 7 months 10 days to this predicts a top for the domed house on May 8, 2006.
(Added on July 31, 2006: This calculation is wrong - I should have said that adding 7 months and 10 days to October 28 gives June 8 as the predicted date for the top of the domed house. Of course, as it turned out, the domed house peak in fact occurred on May 5, just 3 days before my accidently correct prediction. This shows that sometimes it is better to be lucky than it is to be good.)
This would end the entire advance from the October 2002 low and in my view the subsequent drop would probably carry the averages down 20 to 25%.
1 comment:
Carl,
How does the NASDAQ look over the past year for 3 peaks & a domed house?
-David
Post a Comment