
Here is an updated hourly chart of the December S&P futures. The late break today broke past the bottom of the red box at 1224 and so will probably continue down to 1202 or so, the 1/2 point of the current red box. That level also coincides with the 1/2 point of the next blue box which is controlling the drop from the 1250 level.
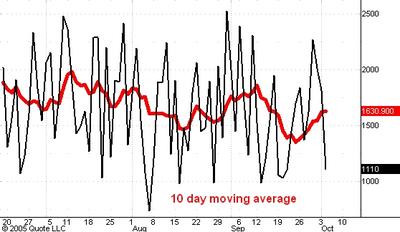
Once we get down to 1202 I think that we will see a strong divergence in the advancing issues numbers which appear in the second chart above this post. The 10 day moving average (red line) of these numbers will almost surely not drop below its recent low even as the market makes a new low for the reaction from 1250.
No comments:
Post a Comment