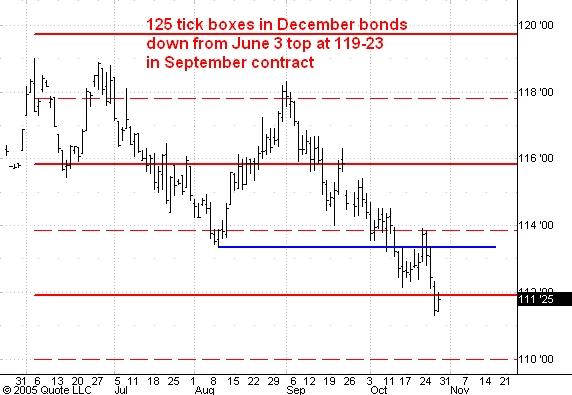
Here is a daily chart of the December t-bond futures.
As I said yesterday a month-end close below the August low (blue line) will mean that the longer term trend in the bonds turned downward from the June 3 top which, in the September 2005 contract, occurred at 119-23. Right now my best guess is that the market will close below 113-11 on October 31.
I have drawn what I think are the boxes which will control the drop from 119-23. My best guess now is that the market will drop into the 106-108 range and make a very important low there sometime during the second half of 2006.
My estimate is based on two factors. First, the market never made it into my 121-123 target range and this tells me that it is likely to make a low above the May 2004 low at 103-02. Second, I use a rule of thumb that says that when the market is in a trading range swings within that range typically reverse only when the upper or lower 1/3 of the range has been reached. In this case I would take the range to be 103-120 and this suggests that the bonds would have to drop below 108-20 before we could start looking for a reversal of the downtrend from 119-23.
There is a box low at 108-00 and the 1/2 point of the next box down is 106-02 so I think one of these two points will probably mark the low I expect to see next year.
No comments:
Post a Comment