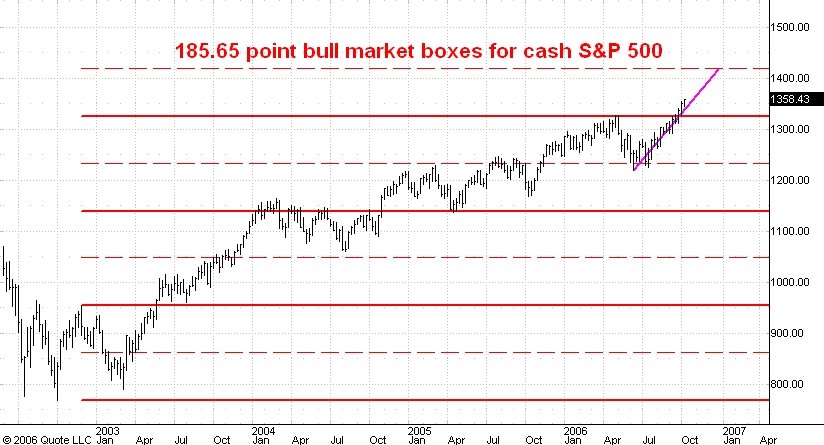
Here is a weekly chart of the cash S&P 500 index. I last commented on this chart here.
On this chart I have drawn the bull market boxes that I have been using for this index over the past 3 1/2 years. These boxes are 186 points high, equal to the first big rally from the October 2002 low.
The midpoint of the current boxe is 1418. This is my target for the current rally in the S&P cash and the futures will probably trade 5-10 points higher. I think these levels will be reached by the end of November.
1 comment:
Carl,
Dont you mean by the 3rd week of Nov (using your prior posts on triangulation of the likely top date). Or has that changed?
Post a Comment