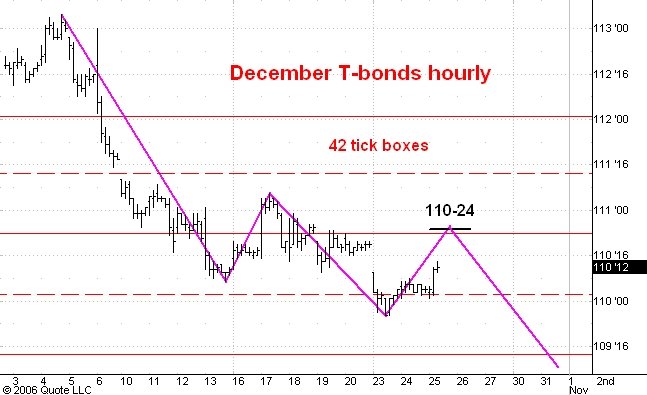
Here is an hourly chart of the December T-bond futures. I last commmented on this market here.
I thought that the 110-10 level would be resistance but the market accelerated above that level a little while ago. You can see this action on the chart as the expanded range hourly bar with its close above the 110-10 level. I think this means that the bonds are headed to the top of the current box at 110-24. Such a rally would be nearly as big as the last rally on the way down too.
After the 110-24 level is reached I expect the market to resume its move down into the 107-108 range.
No comments:
Post a Comment