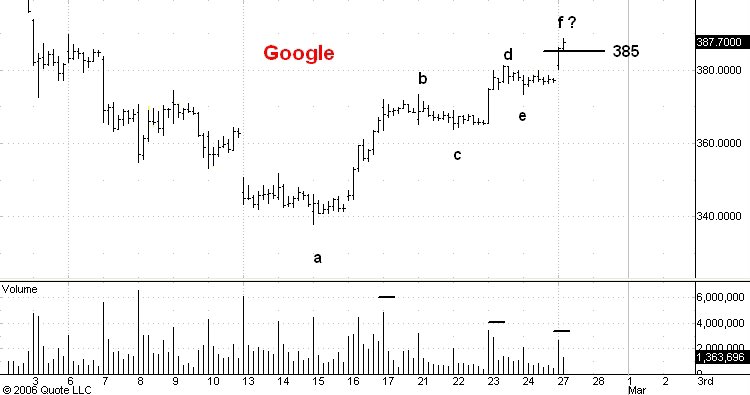
Here is an hourly chart showing regular hours trading in Google.
I think the 385 level is minor resistance. Whenever a market reaches a support or resistance level, especially one that is within an obvious trading range, it is generally good practice to see if the market is giving any confirming indication that it will indeed bounce off of that level.
On the Google chart I have labeled the extremes of the recent swings. Notice how the successive upswings a-b, c-d, and e-f have grown progressively shorter in extent and duration. Notice too how each successive upthrust occurred on less volume than the previous one.
Both these indications are signs of weakness and indicate to me that the 385 level will produce a reaction of at least 10-20 points. But I am still very bullish on GOOG and so I am willing to let the market contradict these indications. So an hourly close at 390 or higher would tell me that the market has to reach 405 before any substantial correction will occur.
No comments:
Post a Comment