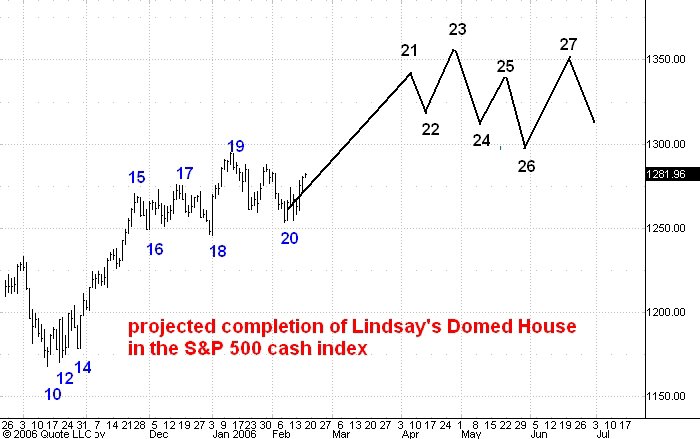
Here is a daily chart of the cash S&P 500. It depicts what I think is the current position of the market within the domed house portion of Lindsay's Three Peaks and a Domed house formation.
I last commented on this here and here. Lindsay fans might want to take a look at these posts.
As you can see on the chart I believe that the market has completed the "five reversals" portion of the domed house and that it has begun its "second story" advance. It is on track to put in a late April high near the 1350 level.
2 comments:
Hi Carl, I am not one who uses Lindsay's work to a great degree, but I have a scenario that calls for a top in the second week of March I would like to propose.
First part of this comes from my interpretation of a Count From the Middle Section. I have my point E at 6-17-03, and point J at 2-19-04, or 247 days. Counting forward 247 days would project the next basic decline to end at 10-23-04, which is within the standard time spans. The actual point A(2) low was 10-25-04, or 249 days. Adding 496 from there yields a target of 3-5-06, which is a Sunday, so 3-6-06 would be the next date.
Using the 3 peaks and domed house, I have virtually the same count, rising into point 23 as we speak. My point 10 is around 9700, but there are a couple of acceptable interpretations I suppose.
The part I had trouble with was using the above with a top to top count, but I think I found a key date to support my case today. There is a small scale top in late Nov. 2005, with a key date of 11-25-05. 102 days from there is 3-6-06, for the early part of the window.
There is a low-low-high count using 1-3-06 and 2-7-06 that yields a date of 3-7-06.
Others may develop between now and then to confirm.
There is a 1 year Gann cycle starting with 3-24-00 (best start date) which is due to top around 3-5-06. The average turn for this cycle is 361.4 days, and last year it came in at 3-5-05 on the S&P. A couple of turns came past 365 so it wouldn't be unusual. Seasonal favorability has also been winding down by this time frame (largely caught by the Gann cycle) as well.
I would therefore speculate that the bull market high should come in near 3-7 plus or minus a few trading days, then a decline that eventually forms the 4 year cycle low due late this year or early next year.
I forgot to add, there is a Bradley turn date centered on 3-8-06 to combine with the above post.
One Elliott Wave count I have is that 3 of 3 is ending, so a couple more 4-5 sequences are needed, and could burn that time.
Post a Comment