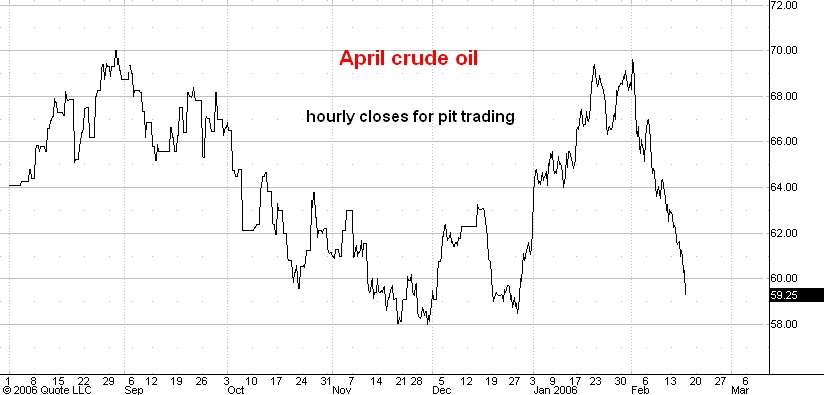
Here is a line chart showing hourly closes during pit trading in the April crude oil futures. The chart goes all the way back to the Katrina high of late August of last year.
At the recent high just after the president's State of the Union message I observed that oil angst was at a peak comparable to the peak seen at the Katrina top. Since then oil has dropped more than $9 per barrel and I think it will drop to $52 or even lower before a substantial rally interrupts the decline.
I thought we would see bounce in April crude from the 60.80 level but evidently the inventory numbers put a scare into the market this morning. You can see from the line chart that the drop from 69.90 in early February has accelerated and shows no sign yet of slowing down. I think this meanst that we will see April crude in the $57-58 range before a rally of more than 3 dollars develops.
No comments:
Post a Comment