The latest issue of Barron's had a bearish cover story on Google. I commented on it here.
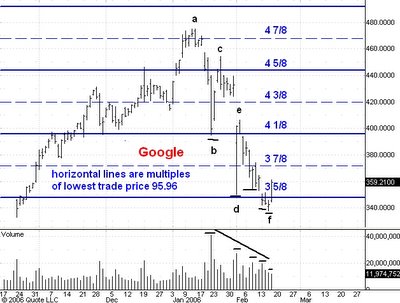
As I said in that post, I think the most interesting thing about the story is that is is providing us with a test of the technical condition of both GOOG and of the general market. The chart above this post is a daily chart of trading in GOOG with the volume numbers below. I took the liberty of extending the bar of the day of the latest earnings announcement down to the after-hours low at 350.
From a tape-reading perspective there are several things about GOOG's activity that interest me.
First, the last down swing from e to f was shorter than the previous two. Moreover, it only broke the low of the c to d swing by 12 points or so while the the previous low at d was 45 points below the low of its preceeding swing from a to b. The bullish implication of this sort of swing shortening is emphasized because both d and f occurred close to very strong support at the 3 5/8 multiple of the all time tading low of 95.96.
Secondly, we note that the successive volume levels at temporary lows on the way down have been dropping. I have shown these days on the chart with horizontal black lines. The behavior of volume is supporting the evidence of the shortening downswings and is telling us that selling pressure has been dropping as GOOG descended to the 337 level.
Finally, the volume on Monday, the day after the Barron's story, was lower than at any of the preceeding temporary lows and the voume on the day of the 337 low at f was even lower than that. This tells me that the Barron's story couldn't force many more sellers into the market and this means that the majority of GOOG's floating supply is now held by people who can't be spooked by bearish news stories. This is a very bullish indication.
I'd say that GOOG has passed the Barron's test with flying colors.
What about the market averages? Well, GOOG has been the bull market leader since its IPO in August 2004. When the bull market leader gets shot down like GOOG has one would expect the averages to drop too. Now GOOG's high on Jan 12 occurred a day after the high of the averages on January 11. But the Dow is now at new bull market highs. And the S&P is trading above the level it had reached when GOOG established point e on the chart.
All in all, I think both GOOG and the general market passed the test of the Barron's story and this has very bullish implications for both.
No comments:
Post a Comment